Posts Tagged ‘Infographic’
How Top Brands Cross-Post Instagram Photos To Facebook & Twitter [INFOGRAPHIC]
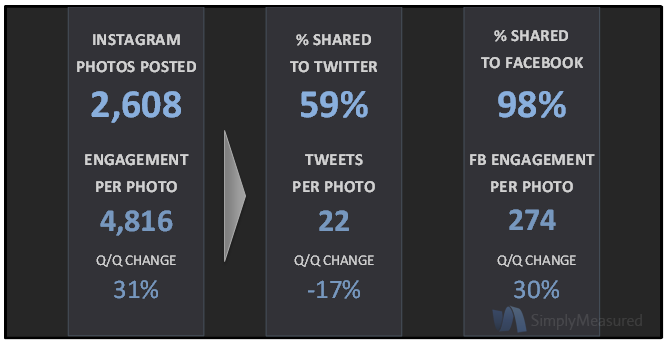
Of the 2,608 photos the top 100 brands shared in the past quarter, 98 percent were posted to Facebook.
Read MoreThe Economic Impact Of Mapping [INFOGRAPHIC]
Google put together this infographic to illustrate some examples of the benefits of maps.
Read MoreThe State Of Infographics [INFOGRAPHIC]
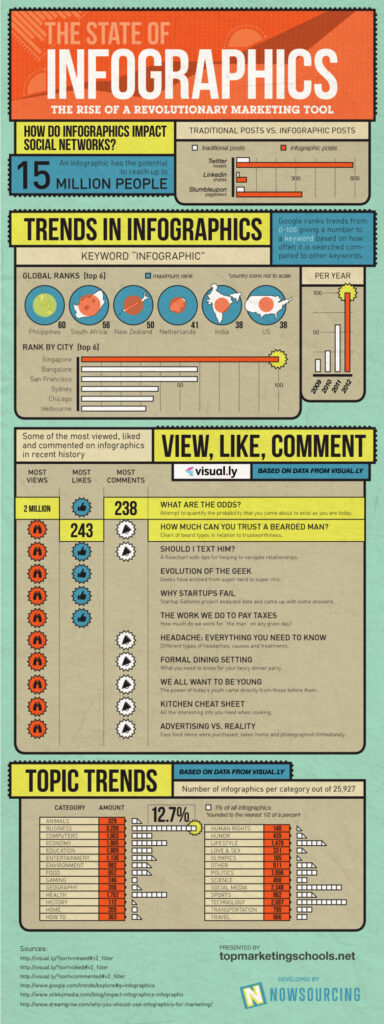
This infographic by Nowsourcing illustrates the effectiveness of infographics as a marketing tool.
Read MoreVideo Games Or Gym Memberships? [INFOGRAPHIC]
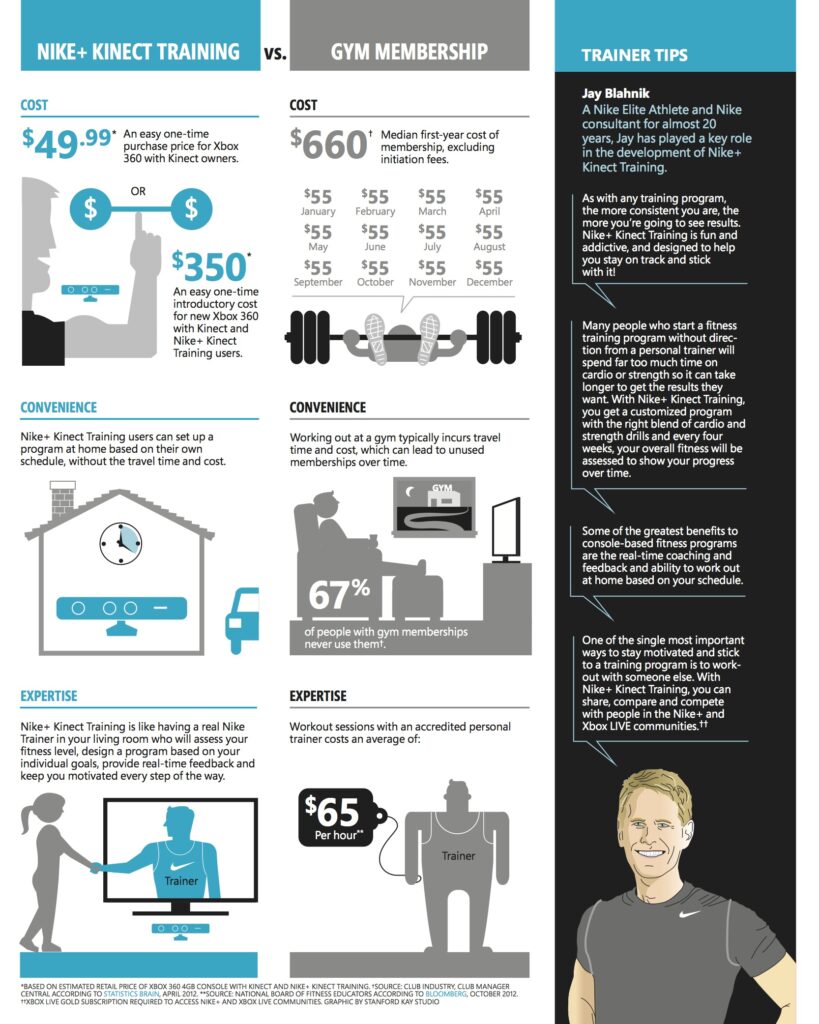
Nike+Kinect video game producers put together this infographic to illustrate the costs of working out at home by playing a video game vs buying a gym membership.
Read MoreTech Startup Success & Failure [INFOGRAPHIC]

90% of technology startups fail. This inforgraphic from Allmand Law looks at the successes and failures of well-known tech startups.
Read MoreThe Super Bowl & Social Ads [INFOGRAPHIC]
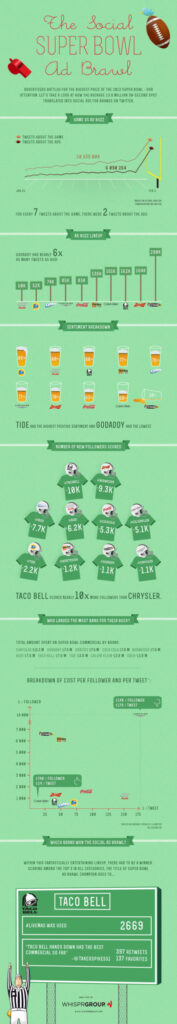
This infographic illustrates that of the 20.9 million Super Bowl XLVII-related tweets sent during the game, nearly 30% were about the ads.
Read MoreEvents & Social Media Marketing Checklist [INFOGRAPHIC]

This infographic from Marketo serves as a visual checklist for marketing your event via social media.
Read More
Linkpocalypse [INFOGRAPHIC]
This infographic highlights recent link building missteps by some prominent brands the consequences.
Read MoreSocial TV & Super Bowl XLVII [INFOGRAPHIC]

This infographic by Trendrr TV breaks down the social TV chatter that Super Bowl XLVII generated.
Read More