Posts Tagged ‘Hospitality Marketing’
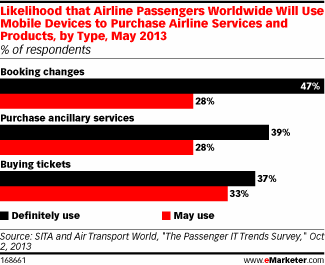
Likelihood Passengers Will Buy Airline Services Via Mobile, May 2013 [CHART]
In 2013, 37% of travelers worldwide said they’d Definitely use their mobile devices to purchase airline tickets & 33% would consider doing so.
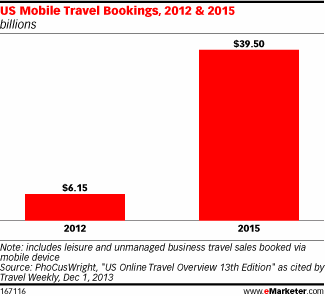
Read MoreUS Mobile Travel Bookings, 2012 & 2015 [CHART]
While US mobile travel bookings sat at $6.15 billion in 2012, PhoCusWright forecast this would rise to $39.50 billion by 2015.
Read MoreGlobal Traveler, 2014 [INFOGRAPHIC]
This infographic from LastRoom paints a picture of the behavior of the global traveler of 2014.
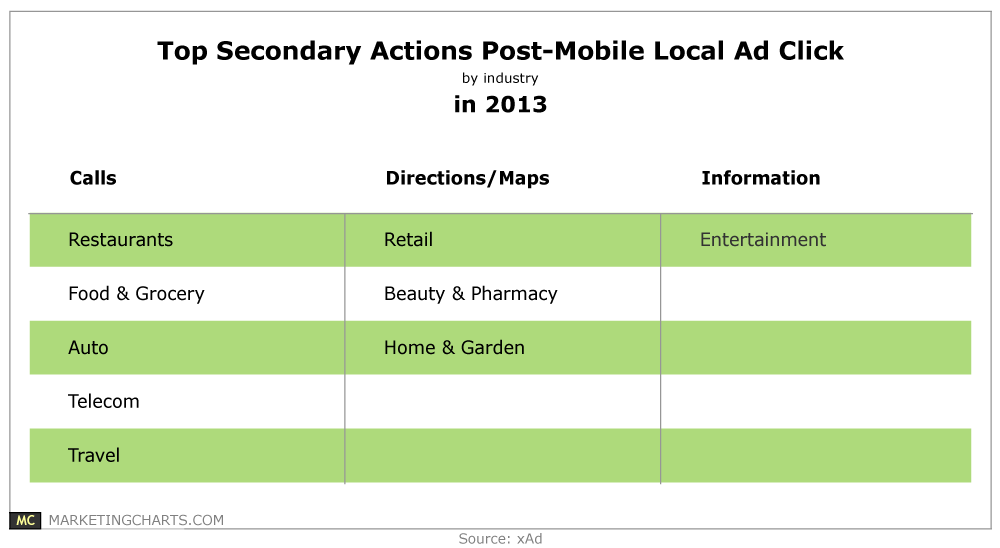
Read MoreTop Secondary Actions After Clicking On A Local Mobile Ad, 2013 [TABLE]
What happens after a mobile users clicks on a locally-targeted ad? Most often, a phone call to the business.
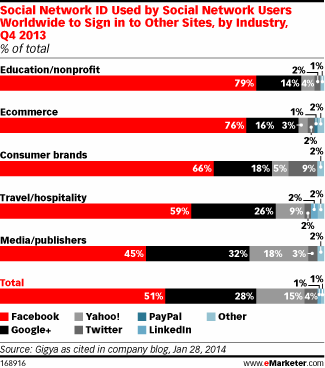
Read MoreSocial Login Used For Select Industry Sites, Q4 2013 [CHART]
With the exception of the media/publishing sector (45%), Facebook boasted the majority of social logins for each industry included in the analysis.
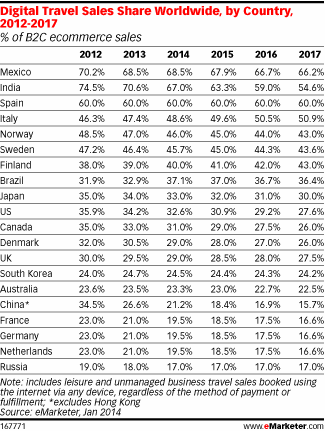
Read MoreGlobal Digital Travel Sales Share By Country, 2012-2017 [TABLE]
Only four markets will see travel increase its share of B2C eCommerce between 2012 and 2017: Italy, Brazil, Finland and South Korea.
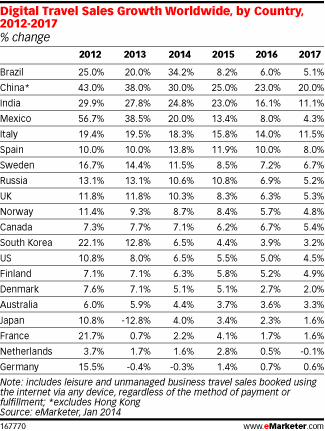
Read MoreGlobal Digital Travel Sales By Country, 2012-2017 [TABLE]
Consumers across the world are becoming more comfortable making purchases on the internet, and digital travel sales are beginning to mature on a global basis.
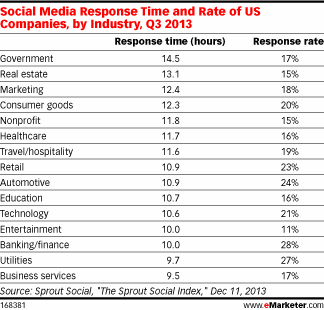
Read MoreSocial Media Response Rates By Industry, Q3 2013 [TABLE]
A breakdown of social media response times and rates by industry found that government companies had the longest response time—14.5 hours—and a response rate of just 17%.
Read MoreThe Personality Types Of Popular Facebook Pages [INFOGRAPHIC]
This infographic by Wishpond illustrates popular Facebook pages by personality type.
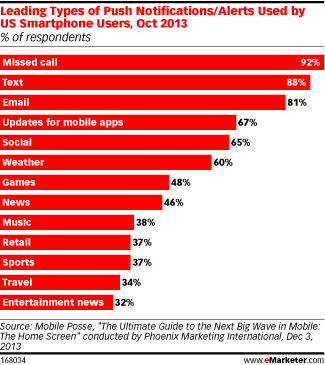
Read MoreMost Used Mobile Notifications, October 2013 [CHART]
On average, smartphone users had signed up for at least one notification from eight of the 14 categories included in the survey.
Read More