Posts Tagged ‘Health Care Marketing’
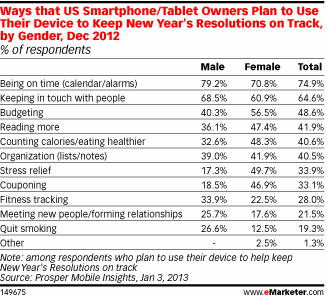
Mobile Device Use For New Year's Resolutions By Gender, December 2013 [CHART]
The resolutions people were most likely to seek aid for on smart phones were everyday challenges: being on time, keeping in touch, budgeting, reading more and counting calories.
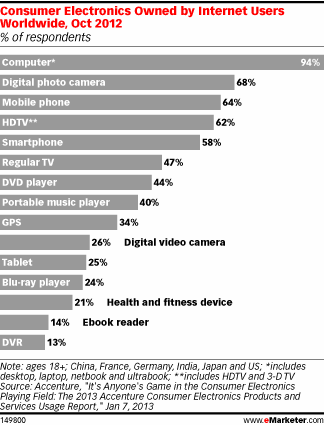
Read MoreGlobal Consumer Electronics Ownership, October 2012 [CHART]
Smart phone penetration climbed from 48% in 2011 to 58% in 2012, while tablet ownership rates almost doubled over the same period, going from 14% to 25%.
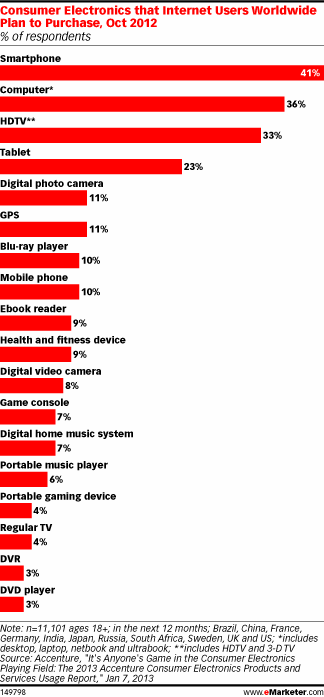
Read MorePlanned Consumer Electronics Purchases [CHART]
The poll found that four devices topped the list of consumer electronics that respondents planned to purchase over the next 12 months—smart phones, PCs, HDTVs and tablets.
Read MoreUS Retail eCommerce By Category, 2010-2016 [CHART]
Sales of new cars make up roughly 15.8% of all US retail activity, according to US census data.
Read MoreAmericans' Attitudes Toward Quality Of Life Factors Compared To Other Nations, January 2013 [CHART]
Americans are sour on their health care system and neutral on their economic system, but they firmly believe that their individual freedoms outshine those afforded citizens in other modern, industrialized nations.
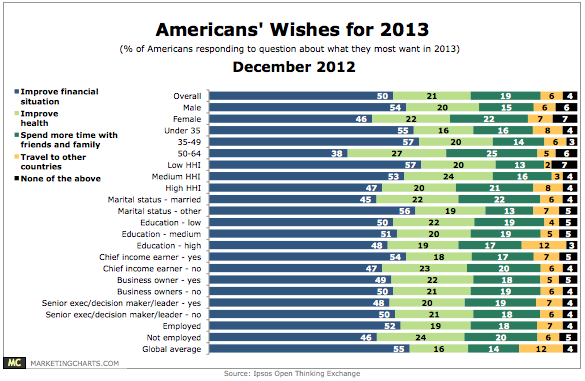
Read MoreAmericans' Hopes For 2013 By Demographics [CHART]
Half of Americans said they would like to improve their financial situation in 2013.
Read MoreAverage Website Conversion Rates By Industry [CHART]
Average conversion rates broken down by industry.
Read MoreTop Local Search Categories, Q4 2011 – Q3 2012 [TABLE]
Restaurants continue to be the leading local search category on the YP Local Ad Network.
Read MoreTime Spent With Mobile Apps By Category, November 2012 [CHART]
US consumers spent an average 127 minutes on mobile apps per day. That’s up 35% from 94 minutes spent per day in December 2011.
Read MoreHow People Prefer To Get Information, December 2012 [CHART]
Across 18 different categories, postal mail is preferred in 15.
Read More


