Posts Tagged ‘Health Care Marketing’
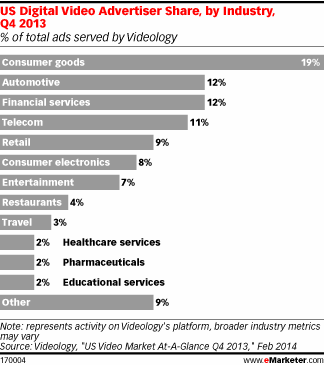
US Online Video Advertising Share By Industry, Q4 2013 [CHART]
Video advertising platform Videology reported that its consumer goods clients in the US were ahead of other verticals in Q4 2013 in serving digital video ads.
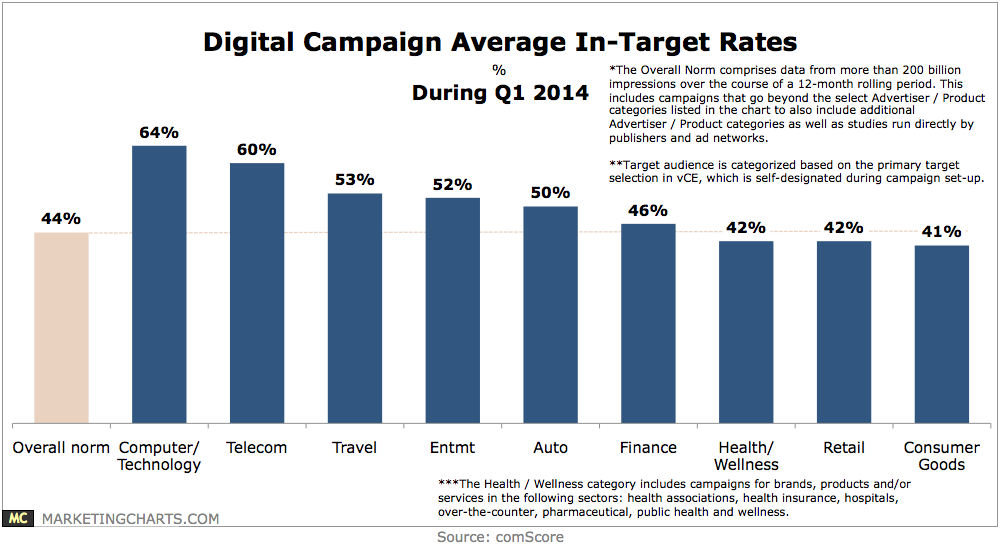
Read MoreOnline Ad Campaign In-Target Rates By Vertical, Q1 2014 [CHART]
In-target rates range from a high of 61% for computer/technology advertisers to a low of 41% for consumer goods campaigns.
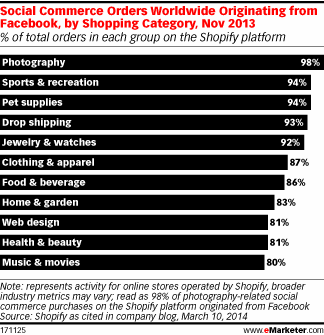
Read MoreFacebook's Global Social Commerce By Category, November 2013 [CHART]
Nearly all photography-related social commerce orders came from the network, and 94% of sports and recreation as well as pet supplies did, too.
Read MoreTop Ten Ways Americans Die [INFOGRAPHIC]
This infographic from Passare.com illustrates the most popular ways Americans die.
Read MoreWebsite Satisfaction By Industry, March 2014 [TABLE]
Social media fares worst, while financial institutions are among the top-rated.
Read MoreTV Ad Effectiveness By Category In 2013 [TABLE]
Casual dining tops the list this year, taking the top spot from Appliances.
Read MoreSpaniards' Top 10 Online Activities, December 2013 [CHART]
Over 62% said they watched TV less because of the time they spent online.
Read MoreHispanics' Sharing Propensity & Influence, February 2014 [CHART]
Hispanics are twice as likely to share content than non-Hispanics, with each user sharing 5 times more often.
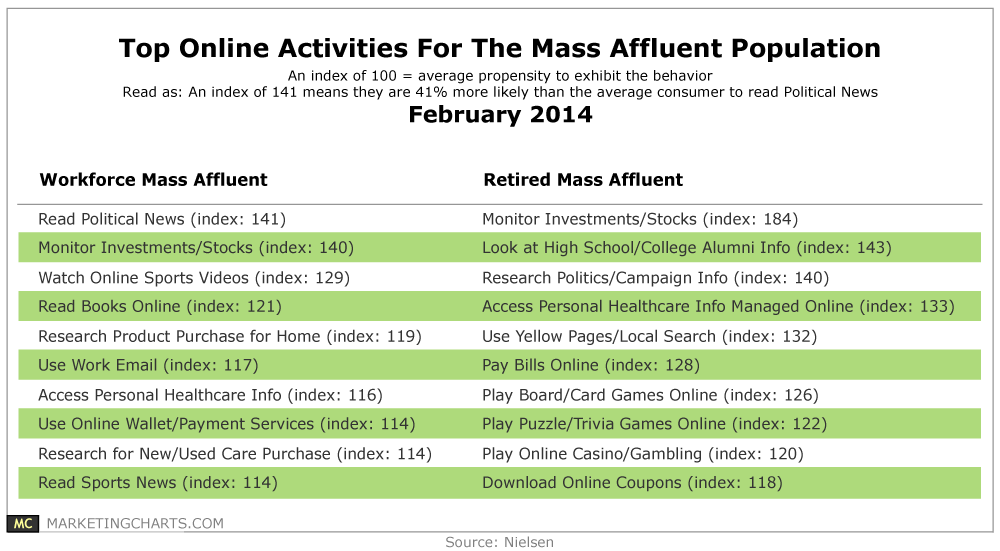
Read MoreTop Online Activities Of Mass Affluents, February 2014 [TABLE]
America’s Mass Affluent represent 12% of US households but enjoy an outsized 26% of the nation’s total wealth.
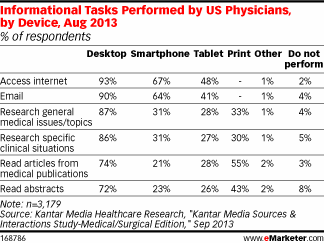
Read MoreDoctors' Informational Tasks By Device, August 2013 [TABLE]
The most common digital activity among US physicians in the survey was accessing the internet, at 97%.
Read More