Posts Tagged ‘Gender’
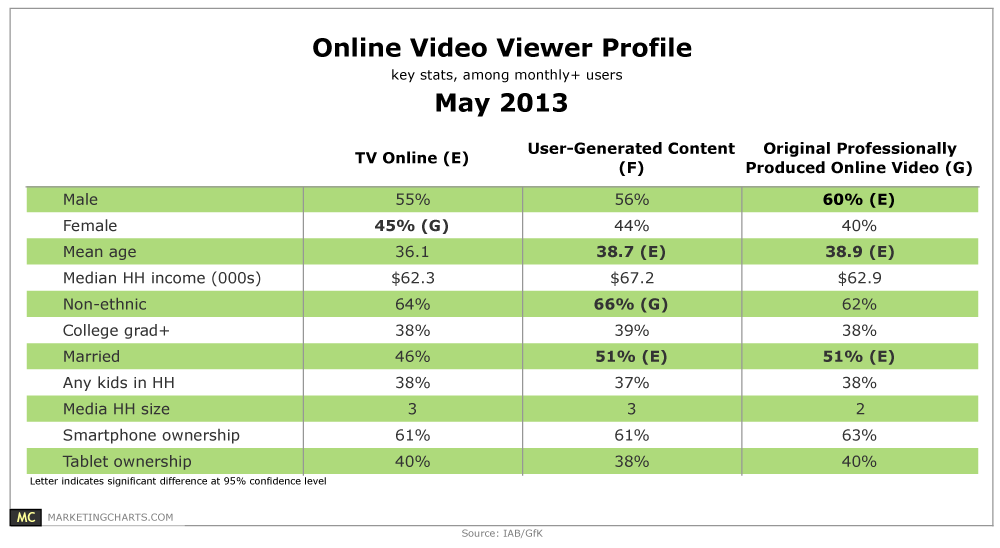
Demographics Of Online Video Viewers By Video Type, May 2013 [TABLE]
1 in 5 or more American adults watch a TV show online (23%), user-generated content (UGC – 31%), or originally produced online video (OPOV – 19%) on at least a monthly basis.
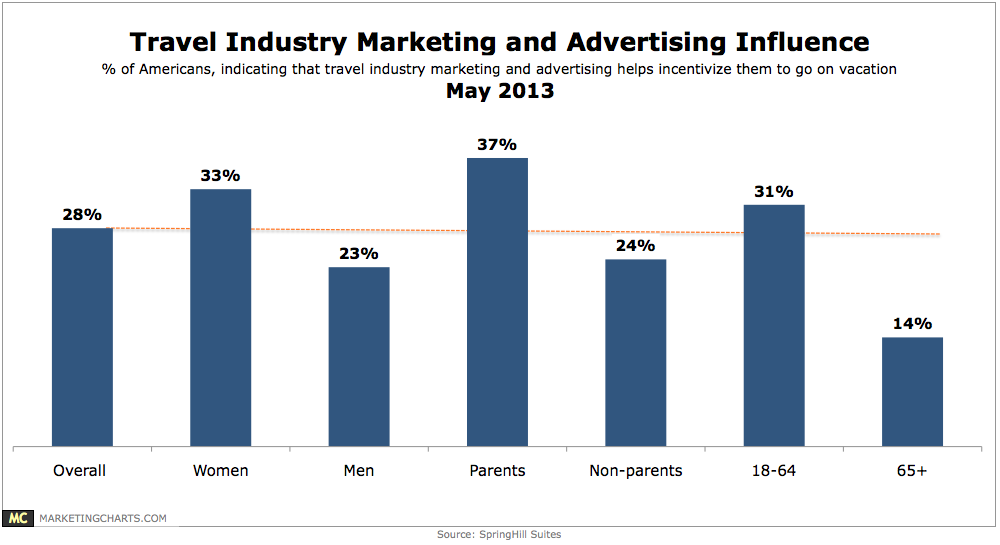
Read MoreTravel Industry’s Marketing Influence By Demographic, May 2013 [CHART]
Roughly 8 in 10 Americans pay attention to travel marketing and advertising.
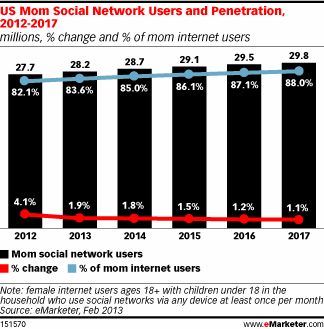
Read MoreAmerican Mothers & Social Network Use, 2012-2017 [CHART]
eMarketer expects the growth in the number of US mom social network users to slow in coming years, given how common the activity already is among this demographic.
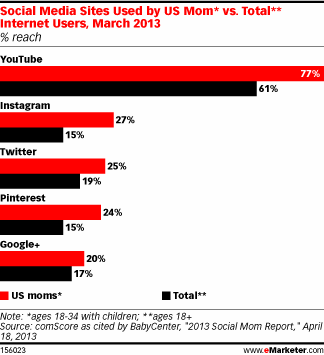
Read MoreSocial Sites Used By American Moms, March 2013 [CHART]
Moms overindex in their use of all the other leading social platforms—YouTube, Instagram, Twitter, Pinterest and Google+.
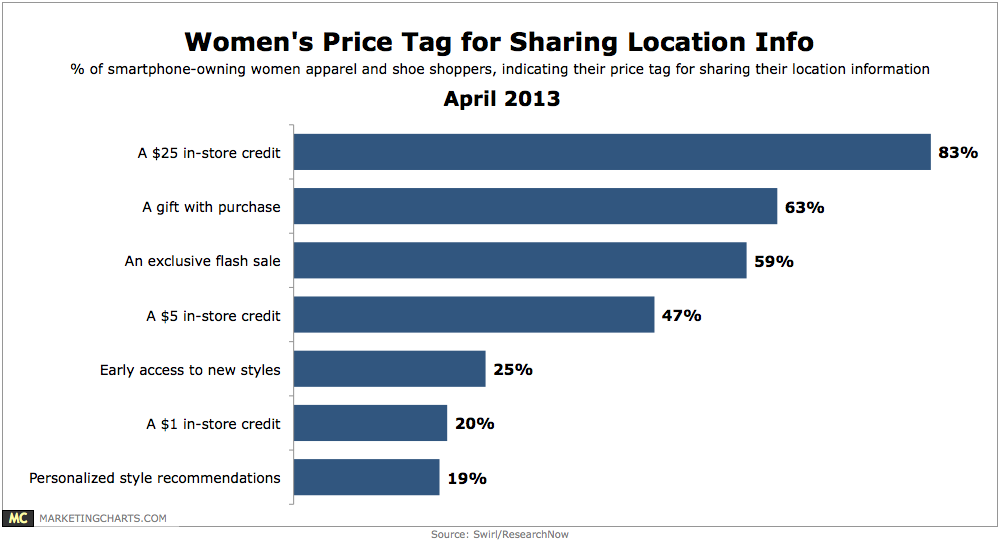
Read MoreThe Costs Women Assign To Revealing Their Location To Retailers, April 2013 [CHART]
What would it take to get smart phone-toting women shoppers to share their location? A $25 in-store credit would do the job for 83%,
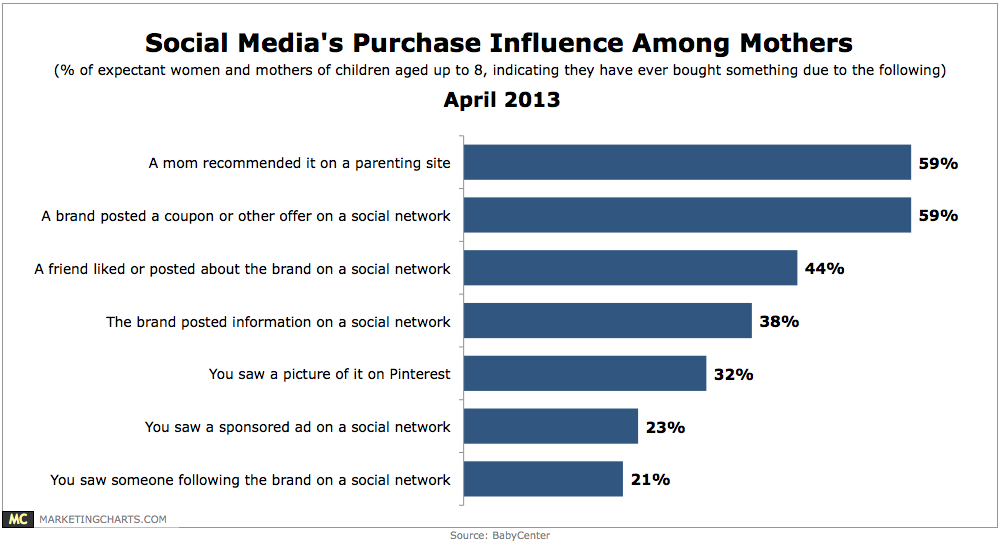
Read MoreSocial Media's Purchase Influence Over Mothers, April 2013 [CHART]
Mothers are 20% more likely than the general population to use social media.
Read MoreGlobal mCommerce Interest By Gender, April 2013 [CHART]
Men appear to be more interested in using their mobile phones than women.
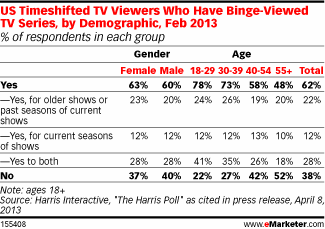
Read MoreBinge TV Viewing Behavior By Demographic, February 2013 [TABLE]
62% of people watched multiple episodes of a TV show in succession, also known as “binge-viewing.”
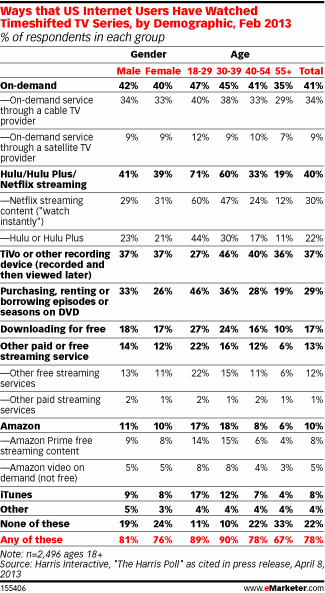
Read MoreHow People Watch Time-Shifted TV By Demographic, February 2013 [TABLE]
Nearly eight out of 10 US adult internet users watched TV on their own schedule.
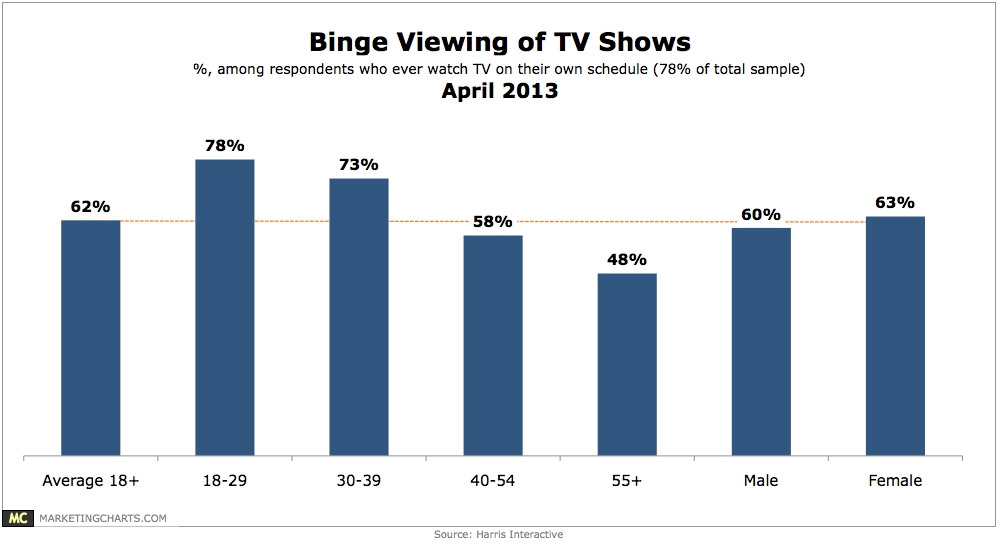
Read MoreBinge TV Viewing By Generation & Gender, April 2013 [CHART]
78% of Americans have watched TV on [their] own schedule and 62% of those have watched multiple episodes of a TV show at a time.
Read More