Posts Tagged ‘Gaming’
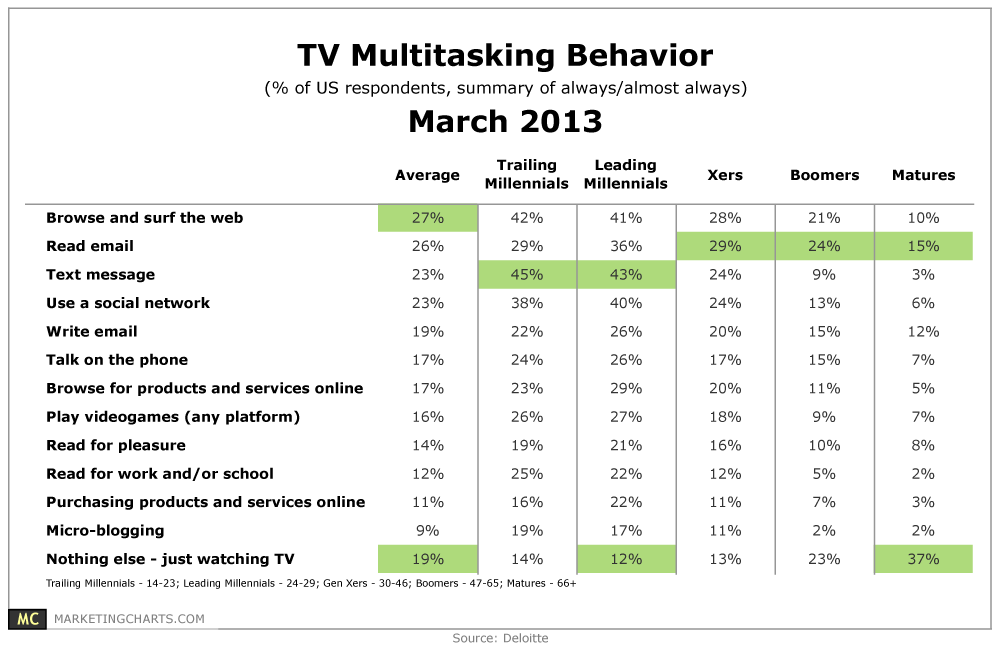
Americans’ Favorite Media Activities By Generation, March 2013 [CHART]
64% of Americans rank watching TV (on any device) as one of their top-3 media activities, down from a high of 71% in 2009 and 2010 but enough to keep TV viewing as America’s favorite media activity.
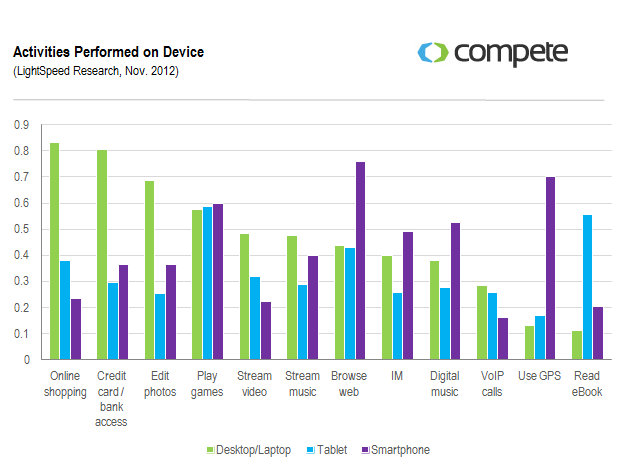
Read MoreActivities Performed On Computers vs. Tablets vs. Smart Phones [CHART]
45% of consumers who use their mobile devices to shop report using the device to compare prices.
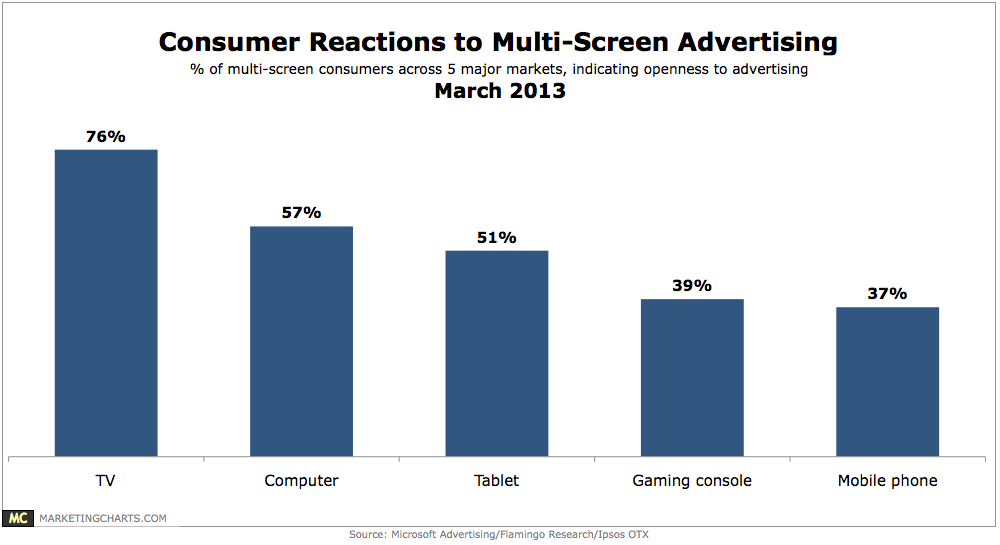
Read MoreConsumer Reactions To Multi-Screen Advertising, March 2013 [CHART]
Almost three-quarters of multi-screen consumers across 5 major markets agree that advertising can be helpful in telling them about new products or brands that might interest them.
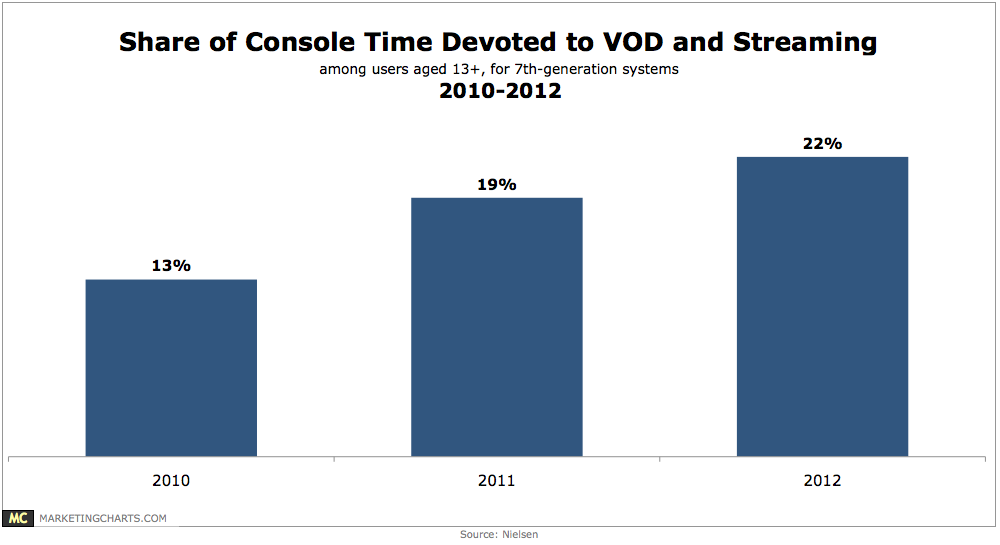
Read MoreUse Of Game Consoles To Stream Video, 2010-2012 [CHART]
Americans still use their game consoles mostly for playing video games, but video on-demand (VOD) and streaming services are capturing more of console usage time.
Read MoreVideo Gaming Landscape [INFOGRAPHIC]
This infographic from LUMA Partners illustrates today’s complex video gaming landscape.
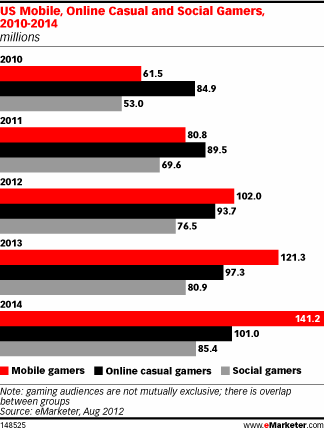
Read MoreAmerican Mobile, Social & Casual Gamers, 2010-2014 [CHART]
Social games are reaching a level of maturity, and therefore the numbers for monthly unique users are falling.
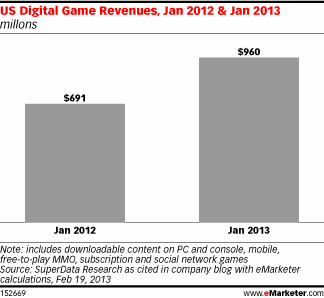
Read MoreUS Digital Game Revenues, January 2012 & January 2013 [CHART]
SuperData pegged the digital games market at $960 million at the beginning of this year, up from $691 million in January 2012.
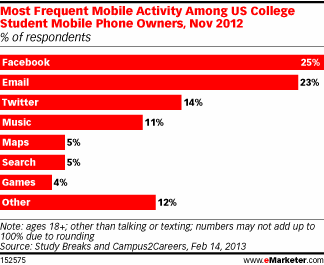
Read MoreCollege Students' Top Mobile Activities, November 2012 [CHART]
When asked to name their most frequent mobile activity, other than talking or texting, fully 25% of college students cited accessing Facebook.
Read More
