Posts Tagged ‘Food Marketing’
Email Reading, Glancing & Scanning By Industry [CHART]
![Email Reading, Glancing & Scanning by Industry [CHART]](https://e-strategy.com/wp-content/uploads/2016/11/Email-Reading-Glancing-Scanning-By-Industry.png)
A majority (53%) of emails are read, meaning that the recipient (presumably) looks at the message for at least 8 seconds.
Read MoreHow Americans Celebrate Independence Day [INFOGRAPHIC]
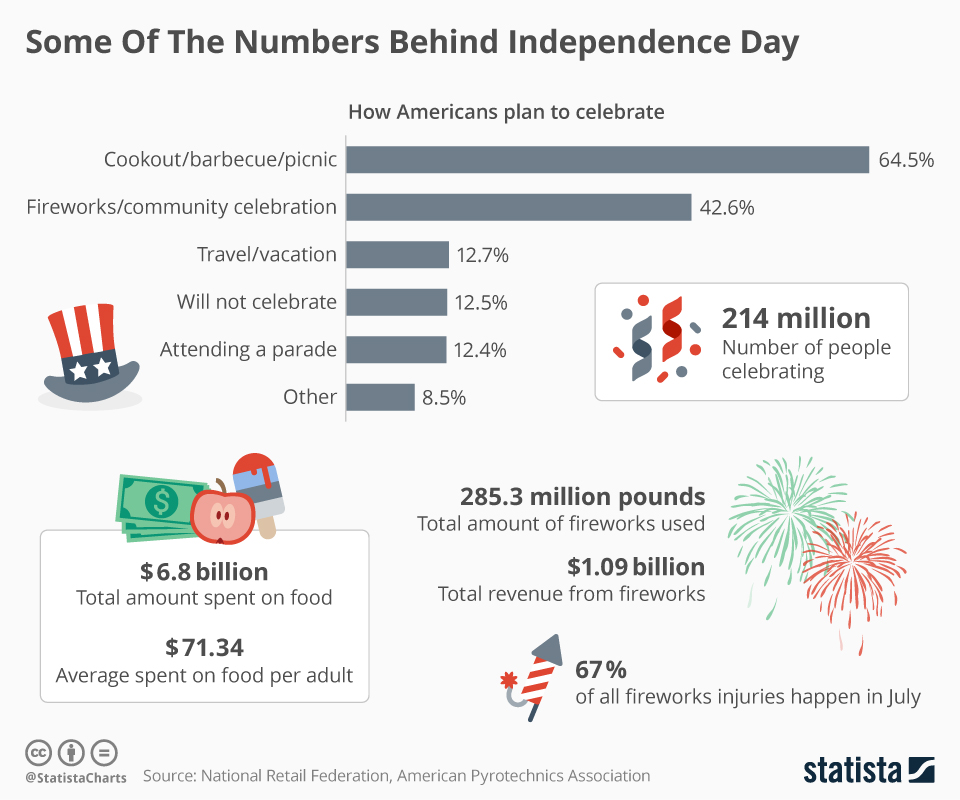
This infographic illustrates how Americans celebrate Independence Day, from eating to travel to entertainment.
Read MoreGlobal Email Deliverability Rates By Industry, October 2015 [CHART]
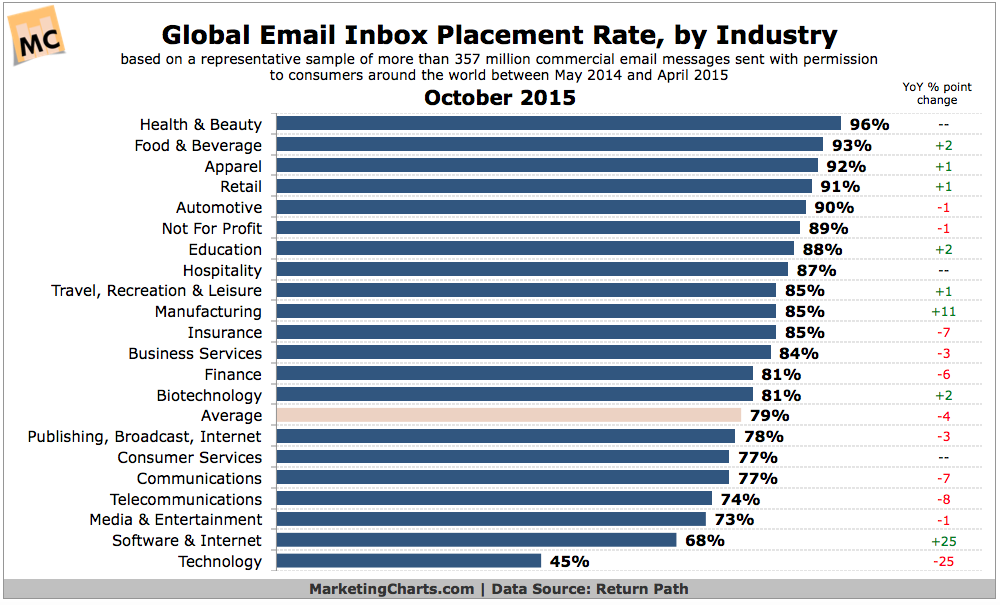
Some 21% of permission emails from legitimate senders around the world failed to reach the inbox during the year-long period from May 2014 to April 2015.
Read MoreSocial Amplification Rate Of US Influencers By Industry, H1 2015 [CHART]
Social amplification rates of US influencers were highest in the electronics category, at 0.66%.
Read MoreThe Internet Of Things [INFOGRAPHIC]
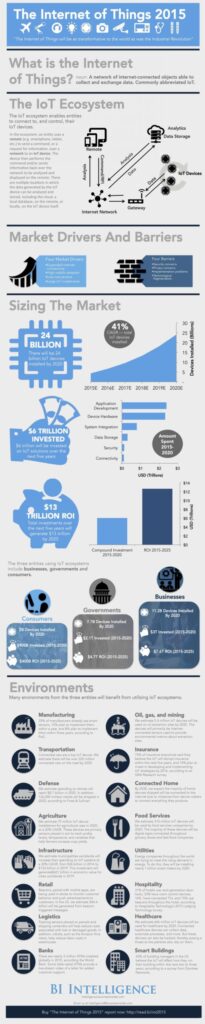
This infographic from BI Intelligence illustrates the state of the industry based on the publication’s most recent report.
Read MoreFacebook Advertising Benchmarks, Q1 2015 [CHART]
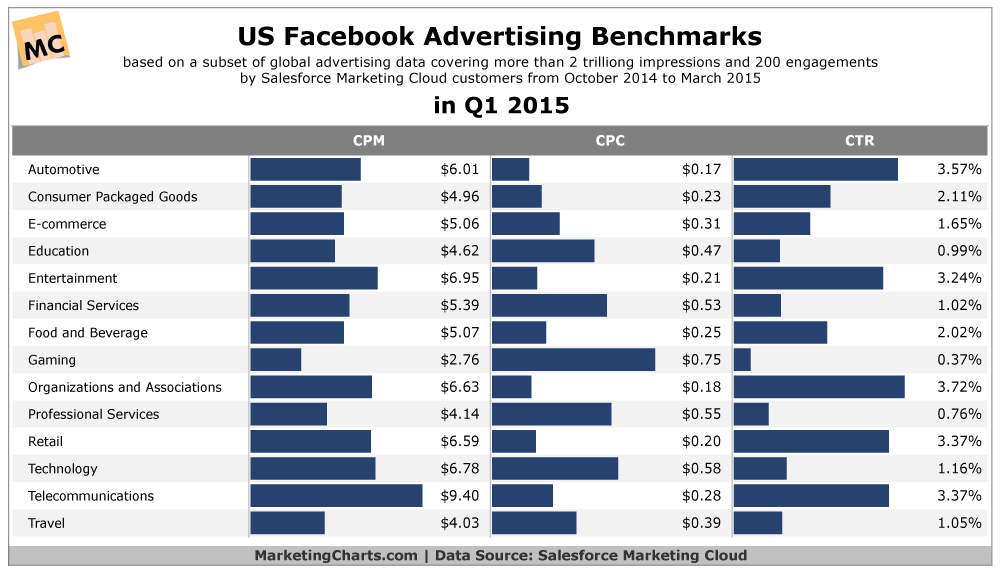
Facebook advertising CPMs were highest for the telecommunications industry and lowest for the gaming vertical in Q1 2015.
Read MoreFrequency Of Pinterest Users' Online Purchases By Category, March 2015 [CHART]
In Q1 2015, Pinterest accounted for the second-highest share of social media-driven site visits in North America, at 19.0%.
Read MoreMost Influential Pinterest Categories For Purchase Decisions, March 2015 [CHART]
There will be 47.1 million US Pinterest users of all ages this year, representing 26.1% of social networkers.
Read MorePrevalence Of Ad Blocking By Website Category, Q2 2015 [CHART]
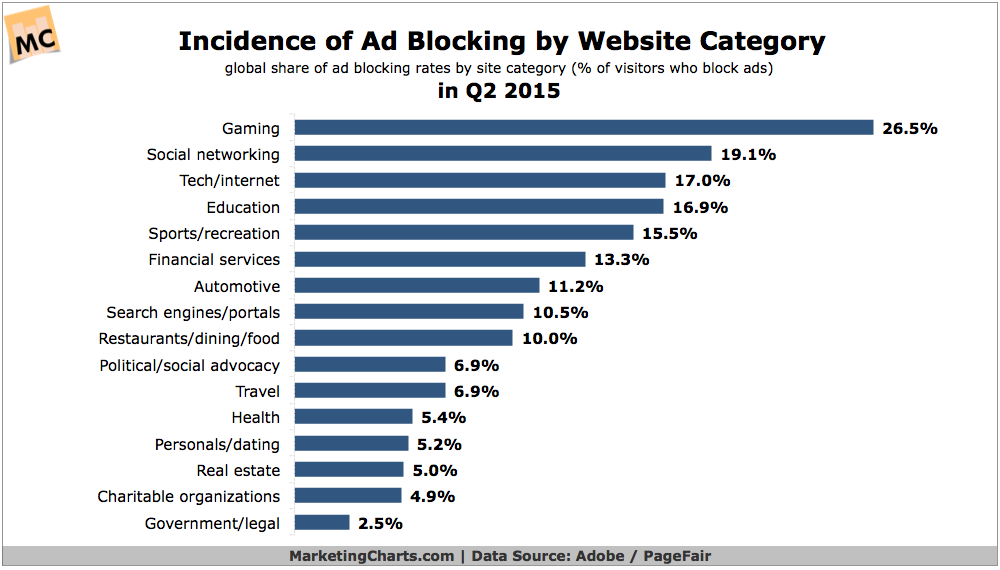
Globally, the number of internet users who use ad blocking software grew by 41% year-over-year in Q2 and reached 198 million in June,
Read MoreApp Notification Opt-in Benchmarks By Industry, 2014 [CHART]
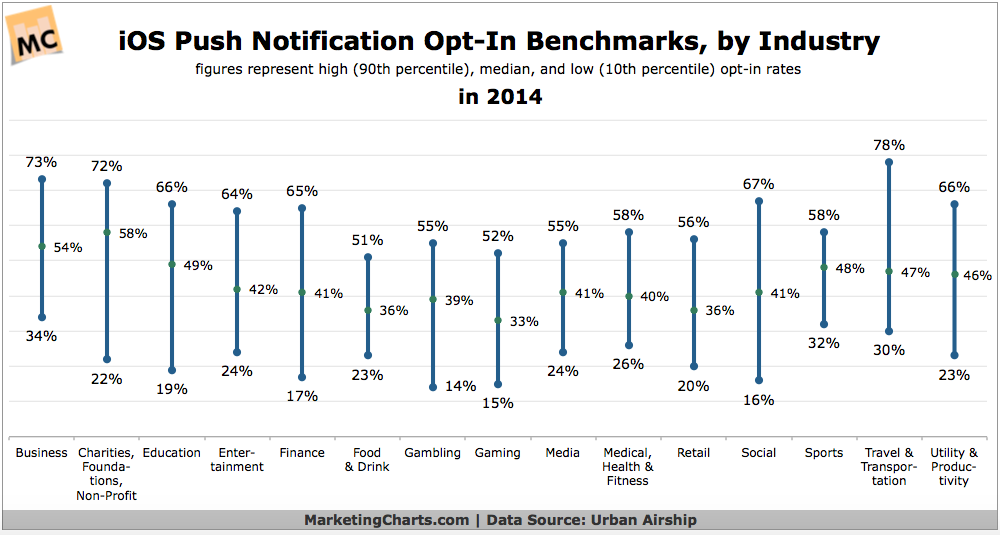
Mobile applications examined by Urban Airship across 15 industries had a median push notification opt-in rate of 42% in 2014.
Read More