Posts Tagged ‘Financial Services Marketing’
Global mCommerce Activities, February 2013 [CHART]
24% of American smart phone users surveyed during Q2 2012 reported scanning a barcode or QR code in the previous 30 days.
Read MoreUS Location-Based Mobile Ads By Industry, 2012 [CHART]
100% of the studied mobile campaigns in the grocery, political, health care, lottery, real estate and education industries used location info of some sort.
Read MoreEmail Read Rates By Sector, Q4 2011 vs Q4 2012 [CHART]
Average email read rates around the world were less than 17% in Q4 2012, slightly down from a year earlier.
Read More2013 Edelman Trust Barometer [PRESENTATION]
The 2013 Edelman Trust Barometer is the PR firm’s 13th annual trust and credibility survey of 26,000 ordinary people, ages 25-64 across 26 countries.
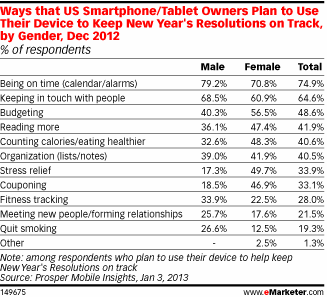
Read MoreMobile Device Use For New Year's Resolutions By Gender, December 2013 [CHART]
The resolutions people were most likely to seek aid for on smart phones were everyday challenges: being on time, keeping in touch, budgeting, reading more and counting calories.
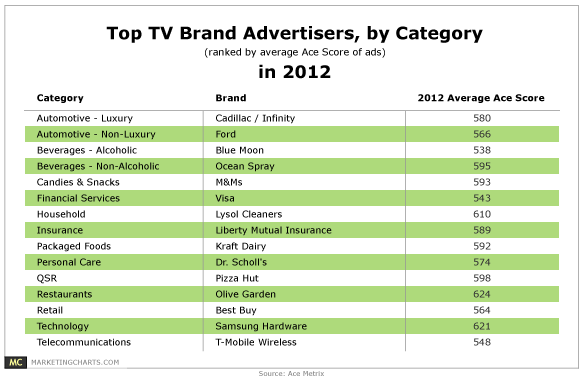
Read MoreTop 2012 TV Brand Advertisers By Category [TABLE]
2012 television brand advertising was marked by creative strategies that stressed innovation while embracing cause and humor.
Read MoreAverage Website Conversion Rates By Industry [CHART]
Average conversion rates broken down by industry.
Read MoreTop Local Search Categories, Q4 2011 – Q3 2012 [TABLE]
Restaurants continue to be the leading local search category on the YP Local Ad Network.
Read MoreHow People Prefer To Get Information, December 2012 [CHART]
Across 18 different categories, postal mail is preferred in 15.
Read MoreUS Search Advertising Click-Through Rates By Industry, Q3 2011- Q3 2012 [CHART]
US overall paid search clickthrough rates for travel and leisure dropped considerably year-over-year from Q3 2011, falling 34%, from 7.94% down to 5.28%.
Read More


