Posts Tagged ‘Facebook’
Social Revenue Per-Visit, Q4 2012 vs Q4 2013 [CHART]
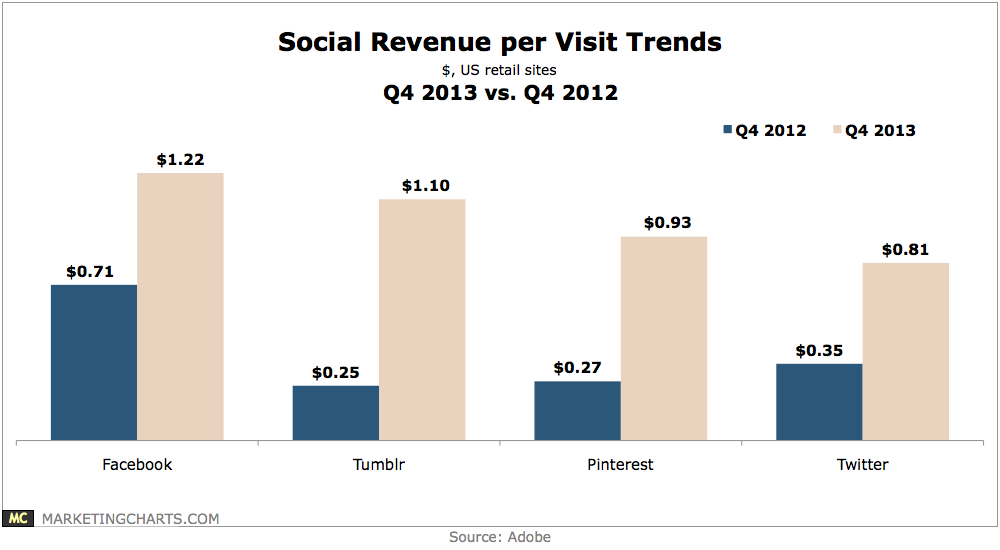
None of the major platforms’ revenue-per-visit (RPV) grew quite as quickly on a year-over-year basis as Tumblr: the network’s RPV shot up by 340% to $1.10 in Q4 2013.
Read MoreFacebook Brand Response Rate, Q2 2012-Q4 2013 [CHART]
Facebook tailed off at the end of 2013 after a rapid rise a year earlier. For the quarter, brands answered 59.4% of questions asked of them on their Facebook pages, the smallest share (by a thin margin) since Q4 2012.
Read MoreSocial Media In 2013 [INFOGRAPHIC]
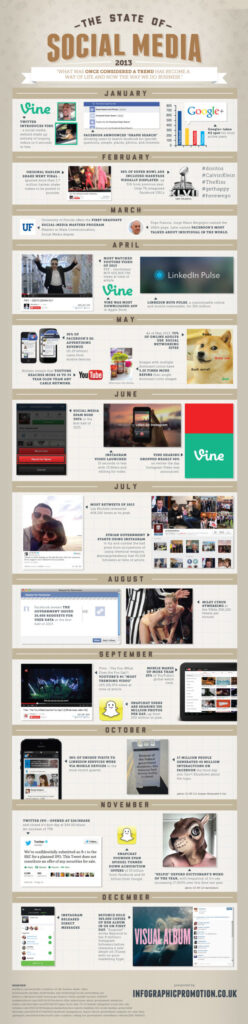
This infographic illustrates significant events in social media during 2013.
Read MoreSocial Search [INFOGRAPHIC]
This infographic by Prestige Marketing illustrates some trends in social search.
Read MoreDesktop-Only Social Network Visitors, 2013 [CHART]
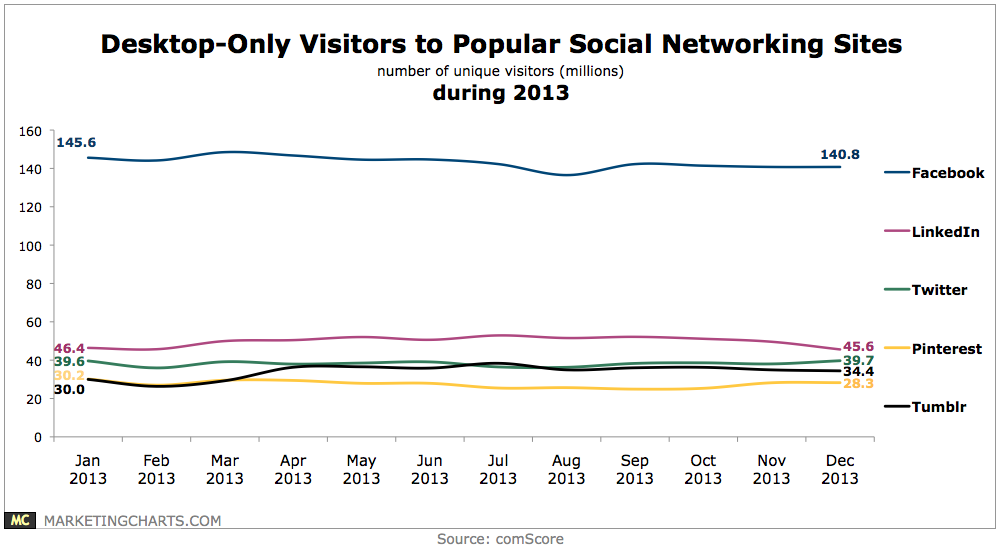
Facebook remains the leader in desktop-only visitors by a large margin, although its numbers appeared to dip slightly during the year.
Read MoreRetail Brand Social Adoption By Channel, January 2014 [CHART]
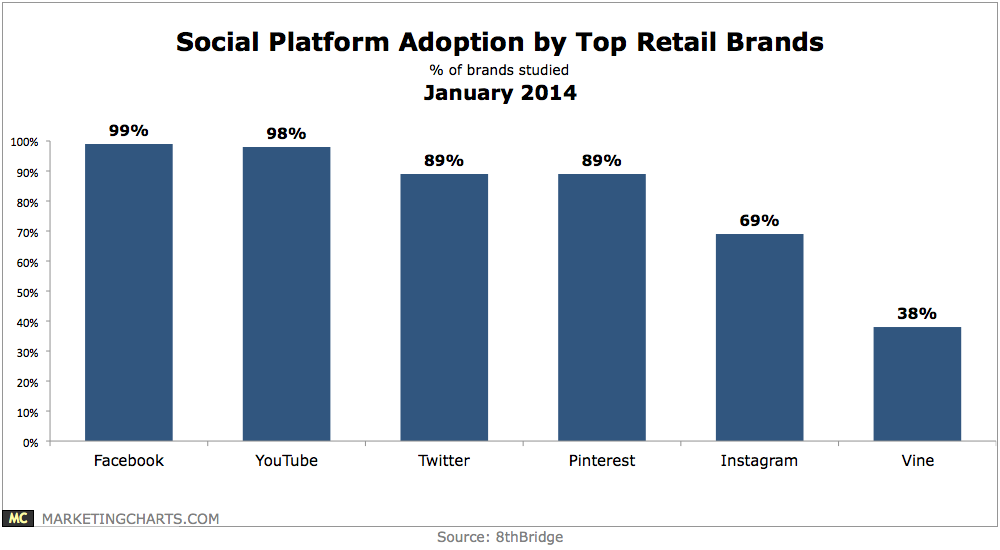
Some 38% of retail brands have already begun using Vine.
Read MoreContent Sharing Growth By Channel, 2013 [CHART]
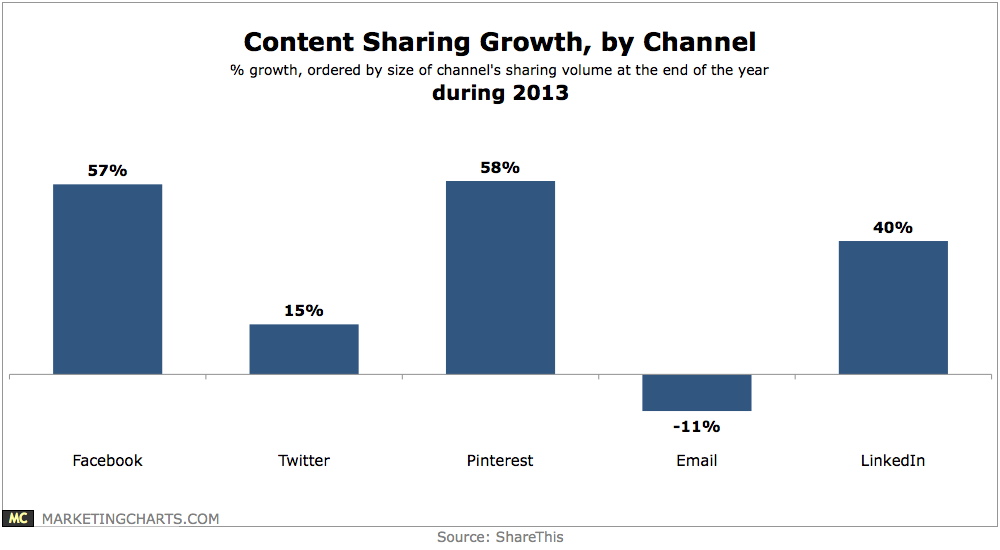
Content sharing to Pinterest increased by 58% during 2013, propelling the social network past email in Q4 to become the third-most preferred social sharing channel.
Read MoreEvolution Of The Marketing Department [INFOGRAPHIC]
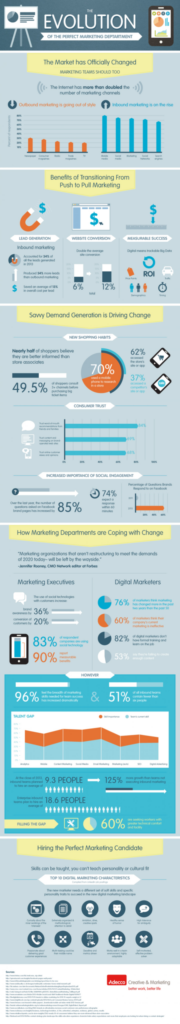
This infographic by Adecco illustrates the changing nature of the marketing department.
Read MoreThe Varieties Of Selfies [INFOGRAPHIC]
This inforgraphic from Marketo illustrates the various types of selfie photos.
Read MoreMobile Content Activities Of American Parents, August 2013 [TABLE]
Parents of children under 18 were 5 percentage points more likely than nonparents to use email on their smart phone,
Read More