Posts Tagged ‘Entertainment Marketing’
Time Spent On iOS & Android Devices By Activity, April 2013 [CHART]
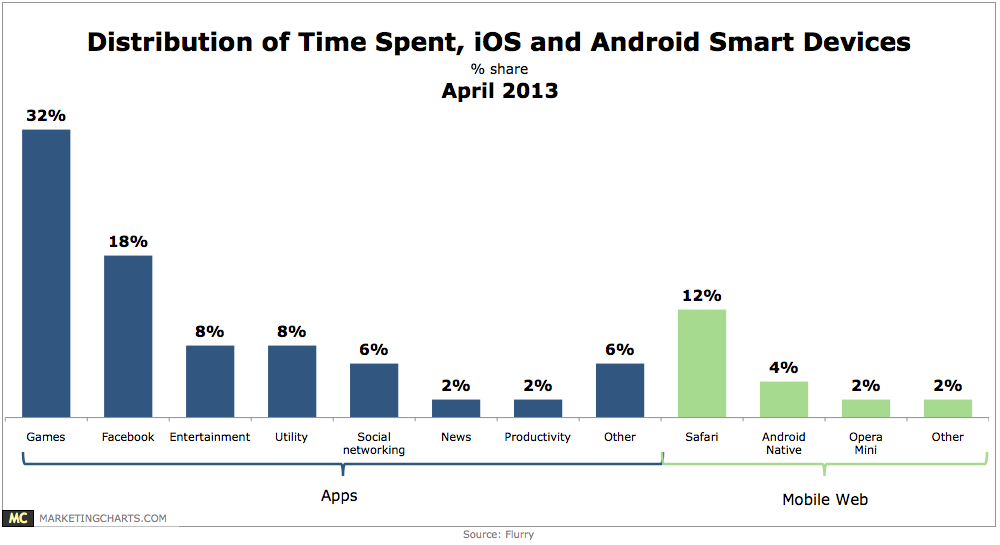
Android and iOS smart phone and tablet users spend an average of 2 hours and 38 minutes per day on their devices.
Read MoreGlobal Mobile Ad Spending Share By Vertical, Q4 2012 [CHART]
The worst performers on tablets vs. smart phones were the fast-moving consumer goods and retail industry, along with the social and dating category.
Read MoreTablet Ad Click-Through Rate Uplift By Industry, December 2012 [CHART]
Click-through rates for entertainment and media, as well as the travel category rose by 81% and 66%, respectively.
Read MoreParents & Family Entertainment Spending, March 2013 [TABLE]
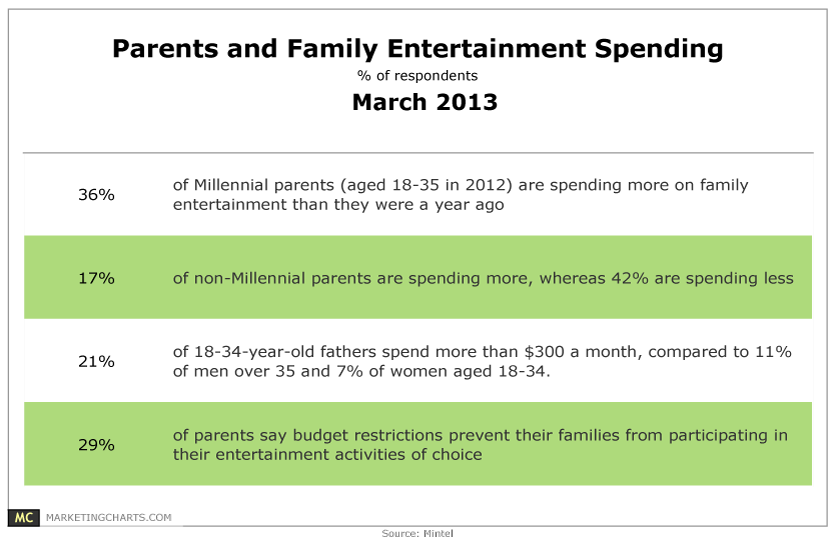
Millennial (18-35 in 2012) parents are twice as likely as non-Millennial parents to say they’re spending more on family entertainment than they were a year ago (36% vs. 17%).
Read MoreActivision's Amazing Real-time Animated Character Demonstration [VIDEO]

Amazing demonstration of Activision’s animation technology that can render a video game character in near photo-realistic fashion.
Read MoreTablet Traffic To US Websites Of Select Industries, January 2013 [CHART]
The top-performing retailer site studied got 13% of internet traffic from tablets.
Read MoreUS Smart Phone Website Traffic To Select Industry Websites, January 2013 [CHART]
The top-performing site that got the greatest share of traffic from smart phones was in the media and entertainment category.
Read MoreTime Spent On US Websites By Select Industries, January 2013 [CHART]
The top-performing media and entertainment site kept users on the site for about 12 minutes per visit.
Read More
Most Popular Television Network Tablet Apps, February 2013 [CHART]
31.7% of tablet owners said they had downloaded a network TV tablet app.
Read More