Posts Tagged ‘Entertainment Marketing’
Industries & Products For Which People Have Written Post-Purchase Online Reviews, October 2012 [TABLE]
Among social network users who took a post-purchase action online, 22% reported posting a review or other comment after an automobile purchase.
Read MoreGlobal Ad Spending Growth By Sector, 2012 [CHART]
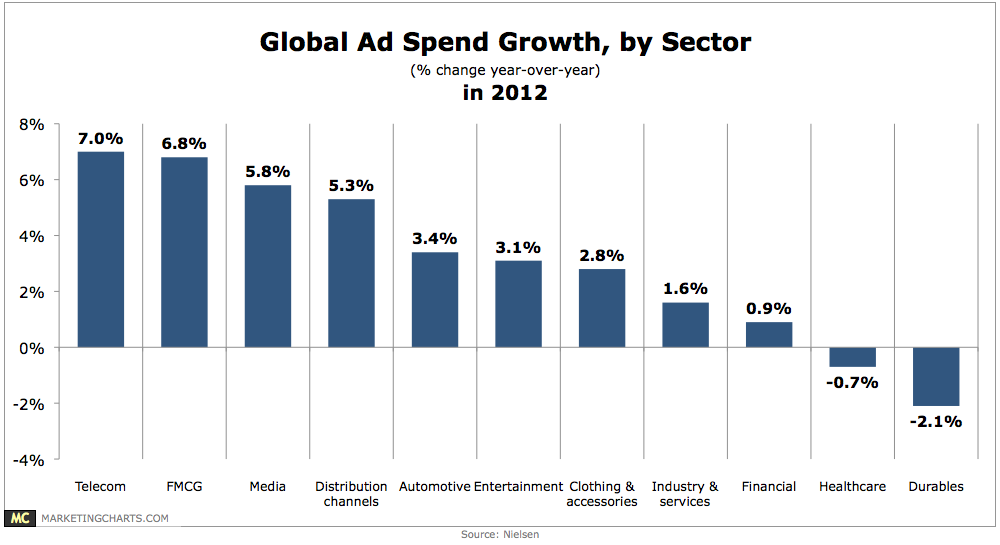
Global ad spending grew by 3.2% last year, but some sectors fared better than others.
Read MoreOnline Social Video Ads Shared Worldwide By Industry, Q1 2013 [CHART]
Entertainment garnered the most social video shares in Q1 2013, which is unsurprising given the adeptness of the industry at creating video content.
Read MoreTime Spent Online By Activity, 2011 & 2012 [TABLE]
On the desktop internet, activity was much more heavily weighted toward social networking, which accounted for 27% of time spent online.
Read MoreTime Spent On Mobile Device Online By Activity, Q1 2013 [TABLE]
US mobile internet users spent the greatest percentage of their mobile web time using email, a 23% share of time spent vs. only 5% of time spent on desktop.
Read MoreTime Spent On Multitainment Activity, April 2013 [TABLE]
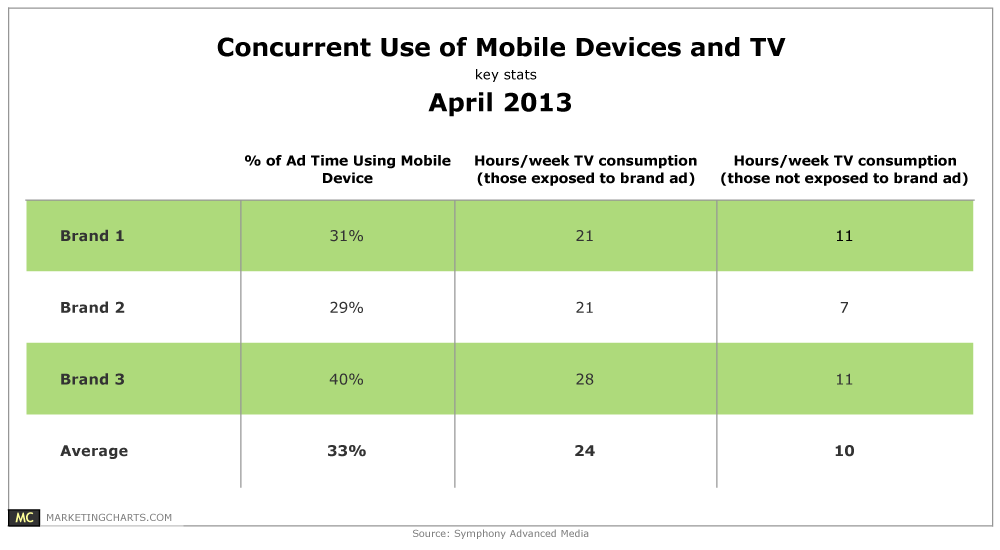
30-40% of actual TV ad viewing occurred concurrently with mobile device usage.
Read MoreNetwork TV Streaming & Pay TV, 2011 vs 2012 [CHART]
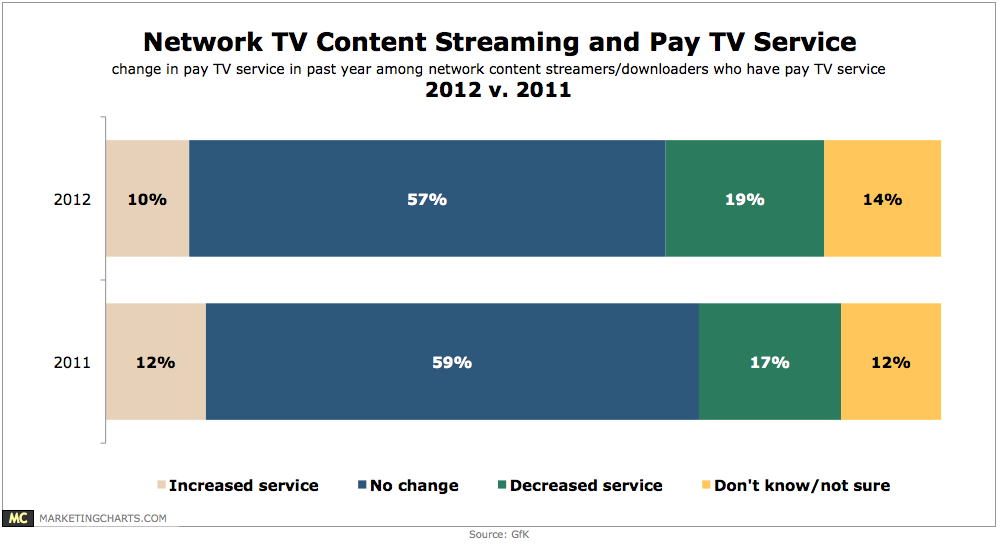
19% of TV video streamers and downloaders in 2012 reported decreasing service (“cord-slicing”) in the past year.
Read MoreShare Of Americans' Time Online By Category, 2011 vs 2012 [CHART]
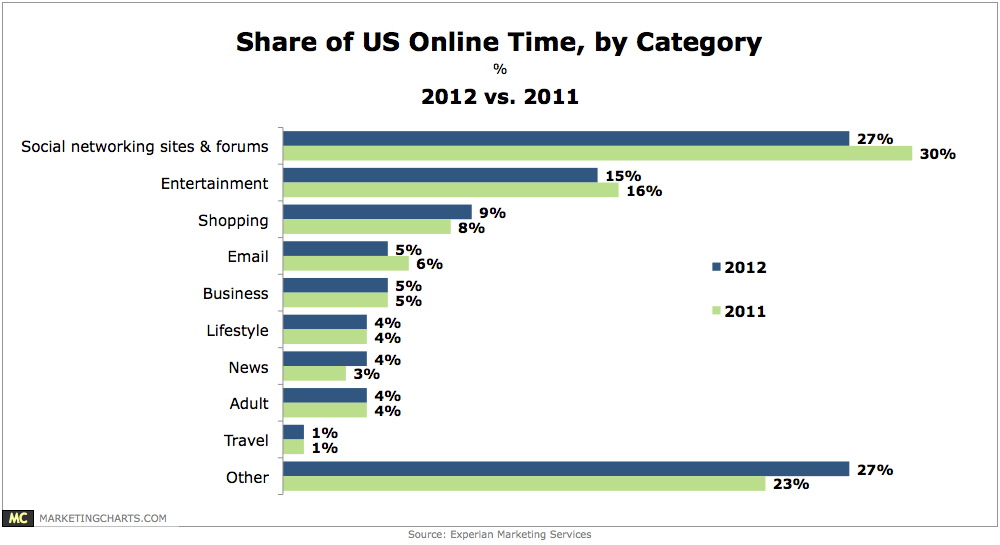
27% of Americans’ time spent online last year was spent accessing social networking sites and forums.
Read MoreSocial Video Advertising Shares By Industry, Q1 2013 [CHART]
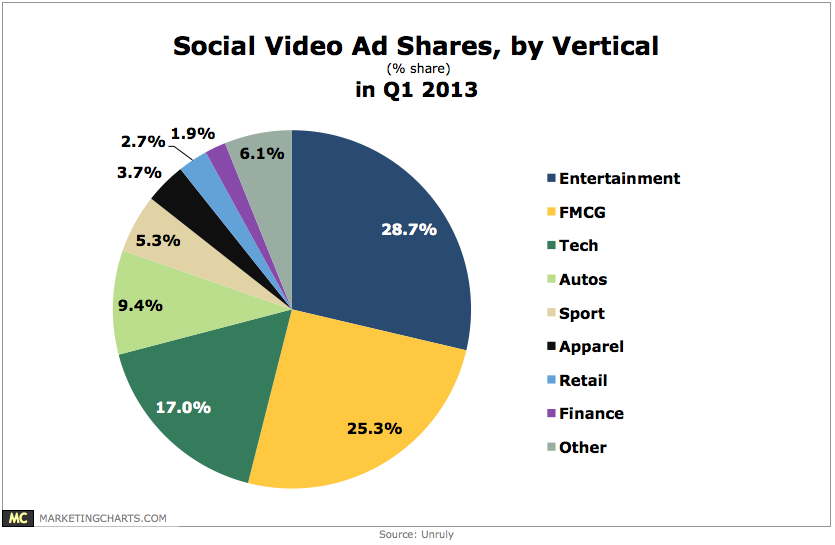
Fast-moving consumer goods ad campaigns generated almost 8.7 million shares during the quarter, up 78.2% from Q4 2012, and representing 25.3% of all shares.
Read MoreBinge TV Viewing By Generation & Gender, April 2013 [CHART]
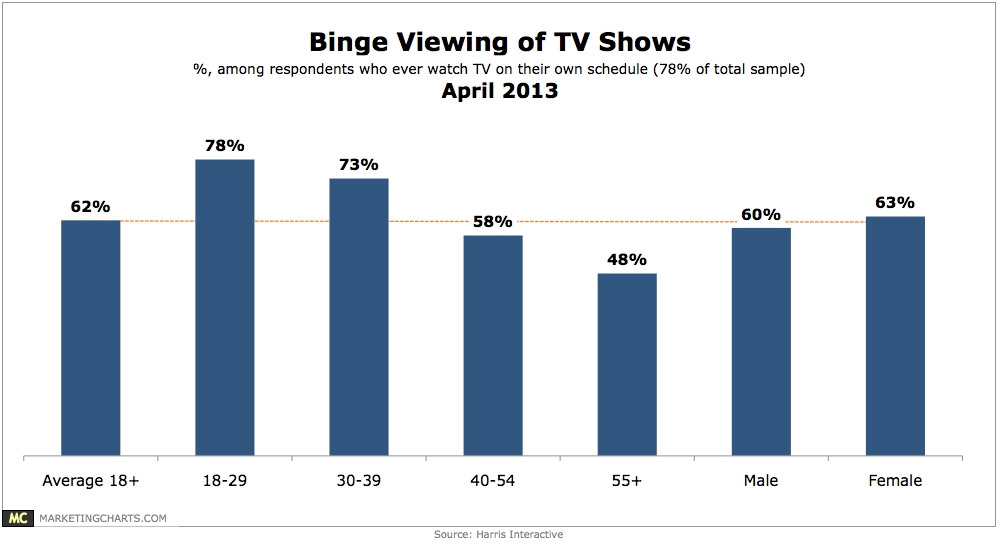
78% of Americans have watched TV on [their] own schedule and 62% of those have watched multiple episodes of a TV show at a time.
Read More