Posts Tagged ‘Entertainment Marketing’
TV Viewing Time By Programming, April 2014 [CHART]
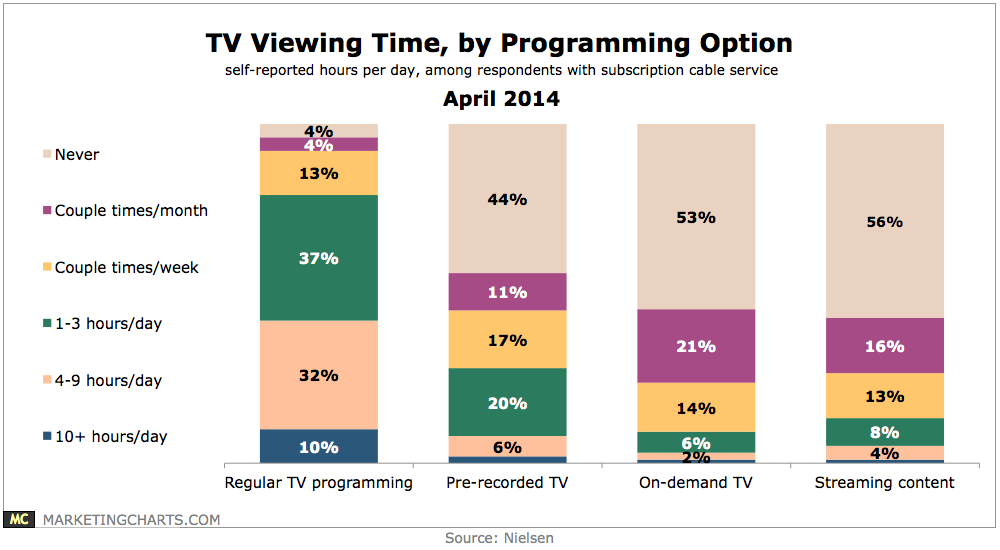
7 in 10 TV households in the US use at least one on-demand service, whether that be a DVR, a Netflix subscription, or video-on-demand from a cable or telco provider,
Read MoreCord-Cutting Intentions, April 2014 [CHART]
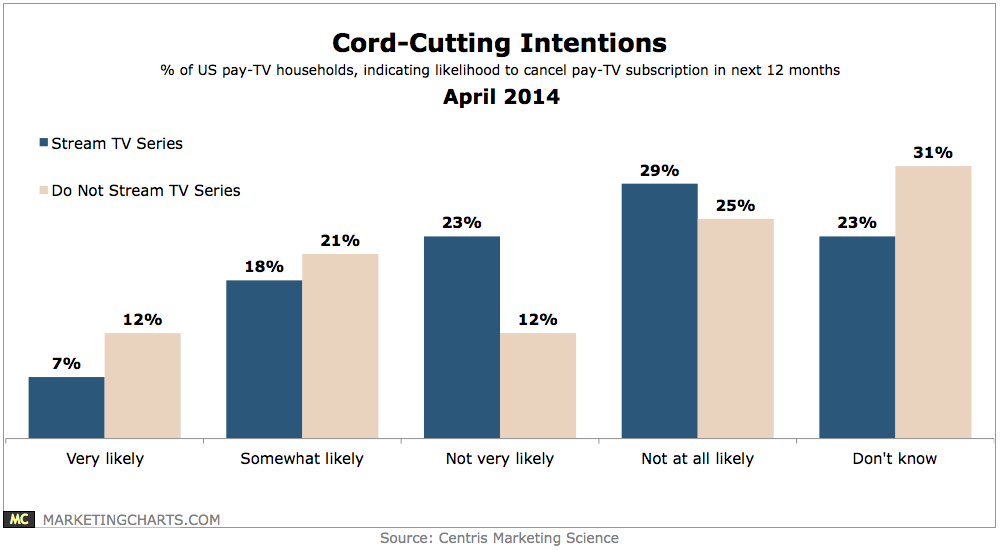
Pay-TV households who stream TV series are actually less likely to cancel their pay-TV subscriptions than those who don’t stream.
Read MoreDemographics Of Live TV Viewers, April 2014 [CHART]
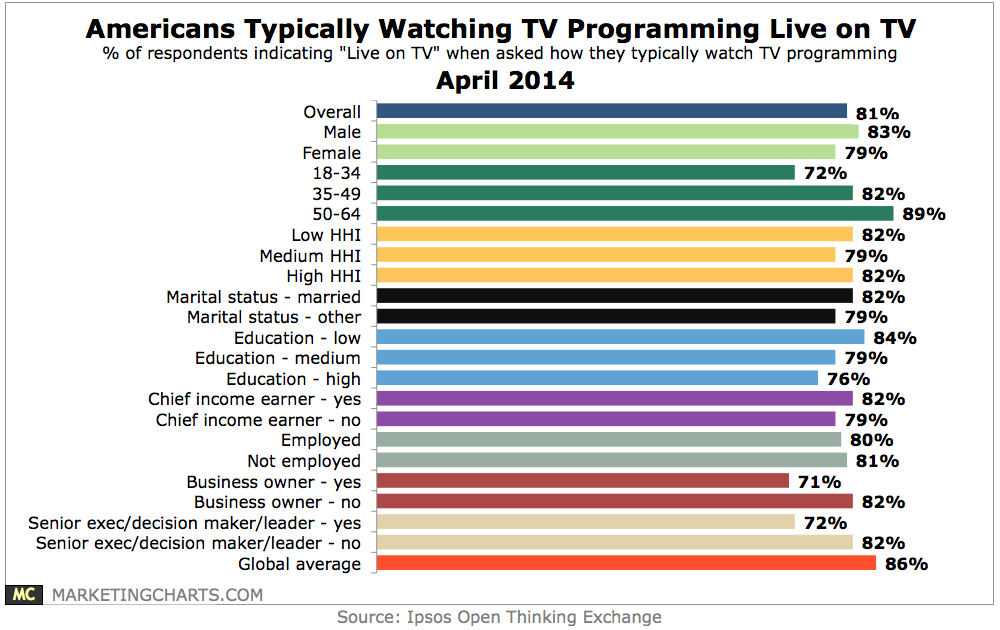
The vast majority of Americans usually watch TV programming the old-fashioned way: live on TV.
Read MoreTV Viewing On Alternative Devices, 2012-2014 [CHART]
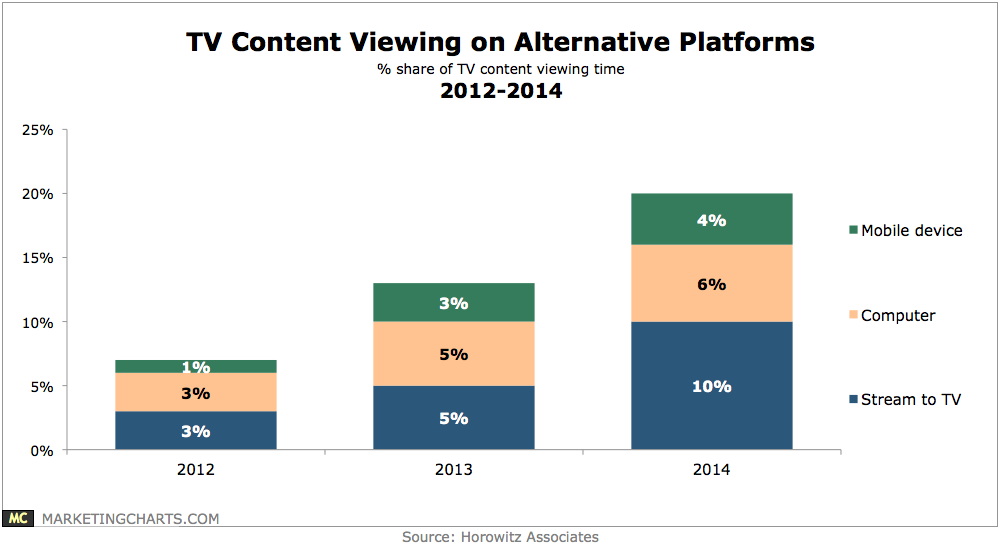
The 20% of TV content viewing time spent on alternative platforms is a significant step up from 13% last year, with the biggest change being for streaming to the TV set (10% this year, up from 5%).
Read MoreGrowth In TV-Related Queries On Google & YouTube, 2012 vs 2013 [CHART]

TV-related searches on YouTube were up 54% during May-December 2013 over the comparable year-earlier period.
Read MoreUS Retail eCommerce Sales By Product Category, 2012-2018 [TABLE]
Total US retail sales are expected to hit $4.732 trillion this year, with eCommerce sales reaching a greater-than-ever share of the total.
Read MoreUS Online Video Advertising Share By Industry, Q4 2013 [CHART]
Video advertising platform Videology reported that its consumer goods clients in the US were ahead of other verticals in Q4 2013 in serving digital video ads.
Read MoreMobile App Store Market Share By Category, February 2014 [TABLE]
Games claimed 41.2% of all Google Play device installs, compared with 7.6% for second-place communication.
Read MoreAmericans' Time Spent On Mobile Internet By Category, Q1 2014 [TABLE]
When it comes to time spent using the mobile internet, apps continue to grab an overwhelming majority of US consumers’ time.
Read MorePay-TV Subscriptions Among Millennial Heads Of Households, Q4 2012 – Q4 2013 [CHART]
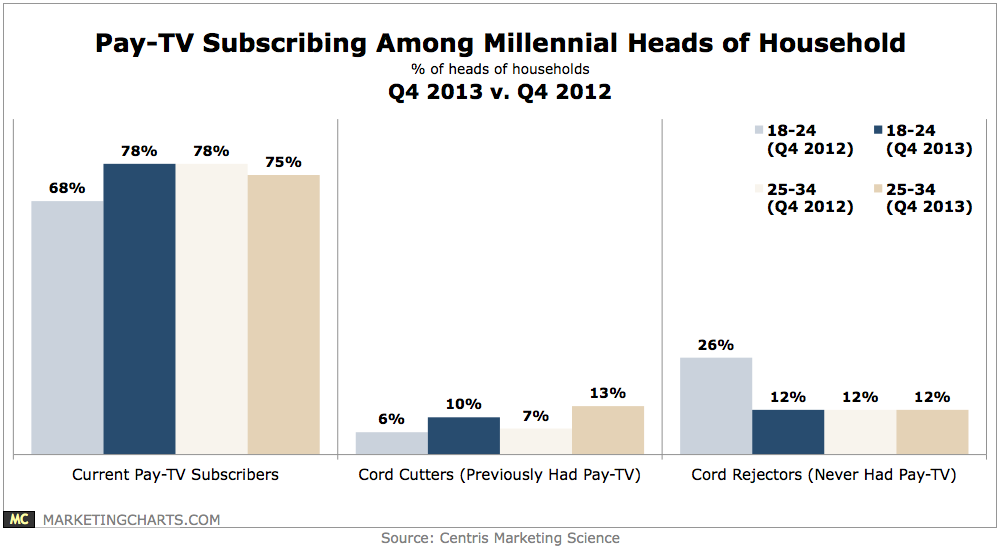
In Q4 2013, a significantly larger share of 18-24-year-old heads of household reported being pay-TV subscribers than did a year earlier, with a concurrent decrease in the proportion claiming to have never had pay-TV.
Read More