Posts Tagged ‘eCoupons’
CPG Coupon Distribution, 2008-2012 [CHART]
After distributing 8.1% less coupons in 2011 than in 2010, CPG marketers held steady last year, distributing 305 billion coupons across all media.
Read MoreMobile Shopper Activities By Device Type, January 2013 [CHART]

Tablet owners are more than twice as likely to use their device for shopping as smartphone owners (44% vs. 20%).
Read MoreMobile Device Use For New Year's Resolutions By Gender, December 2013 [CHART]
The resolutions people were most likely to seek aid for on smart phones were everyday challenges: being on time, keeping in touch, budgeting, reading more and counting calories.
Read MoreeMoney [INFOGRAPHIC]
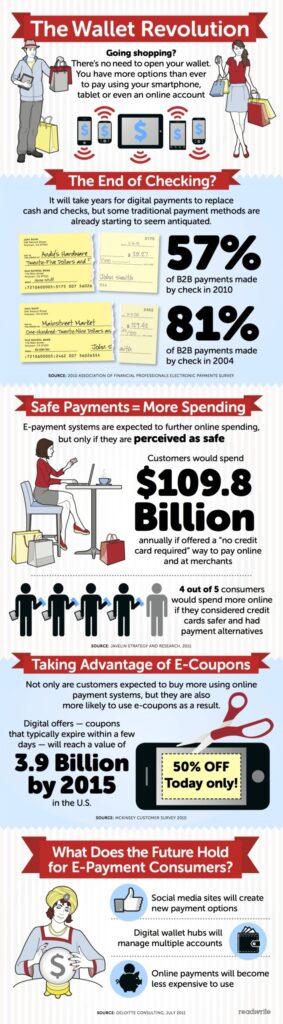
This ReadWrite infographic offers some key data points on the path to digital money.
Read MoreeCoupon Reimbursements By Income [INFOGRAPHIC]

RevTrax said that ‘areas with higher income levels use the most digital coupons, activating nearly 100% more coupons than those at or around the median.’
Read MoreDemographics Of Likely eCoupon Users [INFOGRAPHIC]

RevTrax said that there were five top demographic categories that ‘stand out as most likely to use digital coupons.’
Read MoreDigital Coupon Reimbursements By Region [INFOMAP]
The top digital coupon cities according to RevTrax are Charlotte, N.C.; Rochester, N.Y.; Raleigh, N.C.; Virginia Beach, Va. and Huntsville, Ala.
Read MoreHow Online Presence Prompts Physical Visits To Retailers [CHART]
Ninety-one percent of consumers ‘have gone into a store as a result of an online experience.’
Read More
Holiday Online Deal Seeking By Income, November 2012 [CHART]

Among those intending to purchase holiday gifts, 51.3% of those under $15,000 think that at least one-quarter of their purchases will be discounted.
Read More