Posts Tagged ‘Conversions’
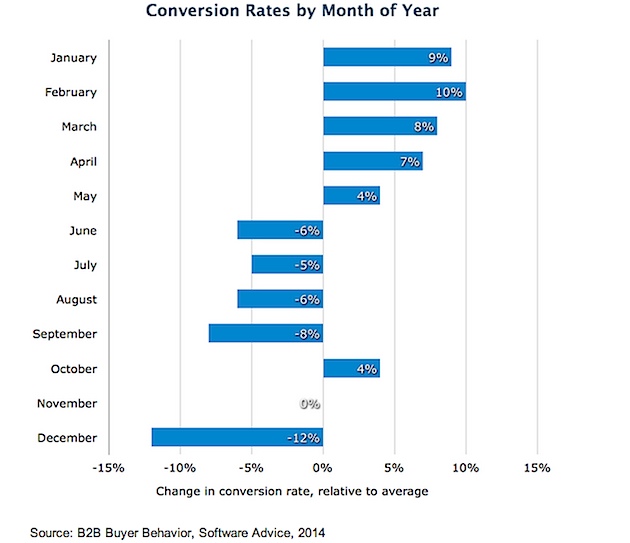
B2B Buyer Behavior Conversion Rates By Month [CHART]
Conversion rates for B2B online leads are highest at the beginning of the year, in part because companies are renewing budgets and new funds are available.
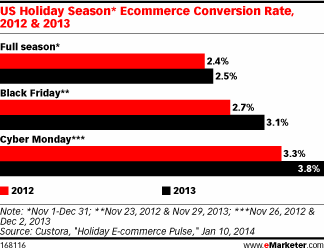
Read MoreUS Holiday Season eCommerce Conversion Rate, 2012 & 2013 [CHART]
Holiday season ecommerce conversion rates also saw a leap between 2012 and 2013, most dramatically on Cyber Monday, when they increased from 3.3% to 3.8%.
Read MoreEvolution Of The Marketing Department [INFOGRAPHIC]
This infographic by Adecco illustrates the changing nature of the marketing department.
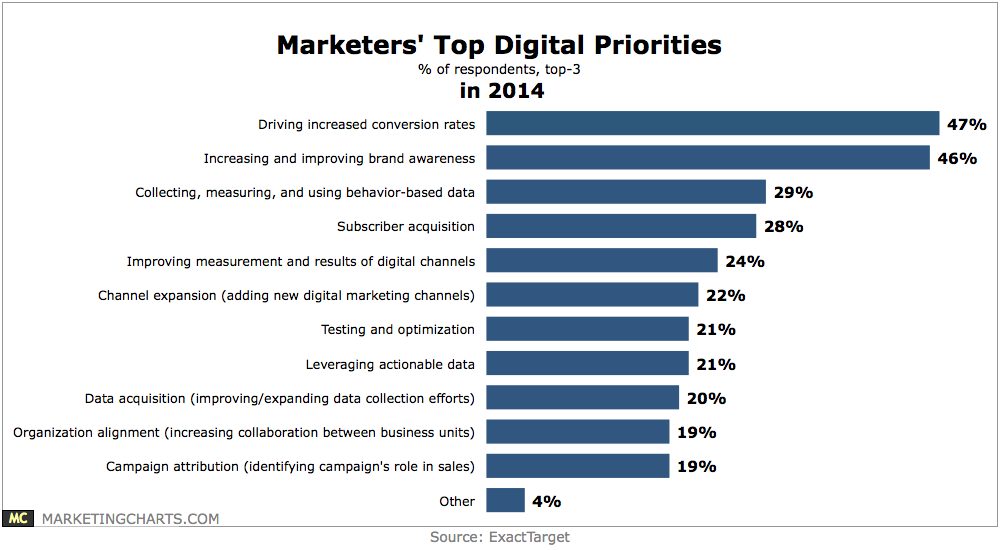
Read MoreMarketers’ Top Online Priorities For 2014 [CHART]
Almost half of marketers wanted increased conversion rates (47%) and increasing and improving brand awareness (46%).
Read MoreGrowth Of mCommerce [INFOGRAPHIC]
This infographic by Judo illustrates the growth of mCommerce.
Read MoreContent Marketing Measurement [INFOGRAPHIC]
This infographic by BrandPoint illustrates how to measure content marketing efforts.
Read MoreWeb Form Best Practices [INFOGRAPHIC]
This infographic from SingleHop illustrates web form design best practices.
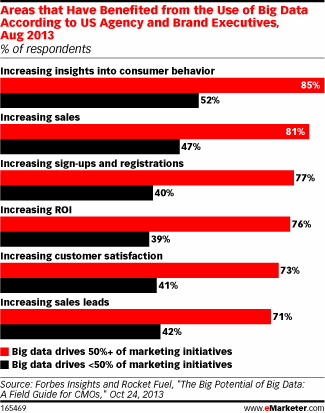
Read MoreAreas That Have Benefited The Most From Big Data Use, August 2013 [CHART]
Among US agency and brand executives, 85% said Big Data had yielded more than half of marketing initiatives when it came to increasing insights into consumer behavior.
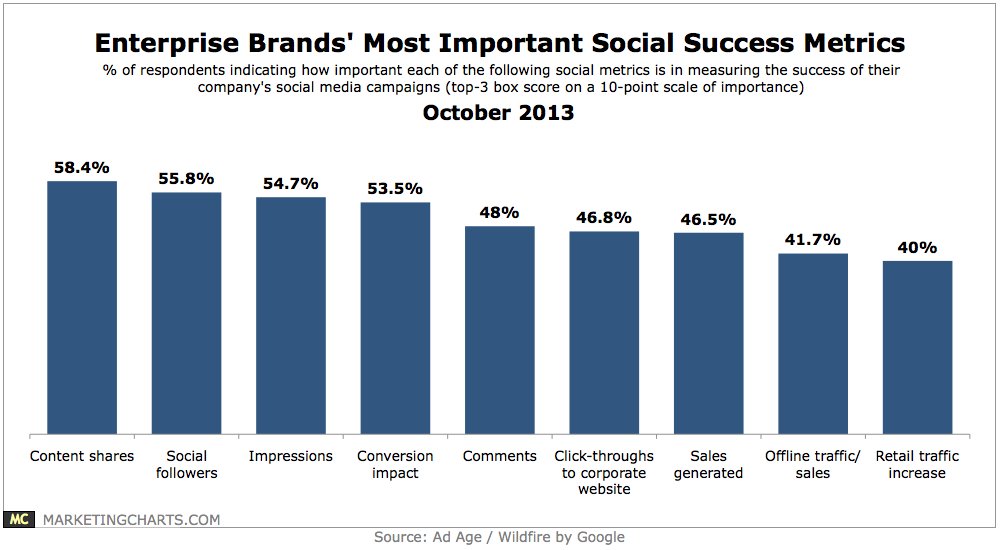
Read MoreTop Social Media Metrics For Enterprise Brands, October 2013 [CHART]
A leading 58% of respondents consider content shares to be an important metric for measuring the success of their social media campaigns.
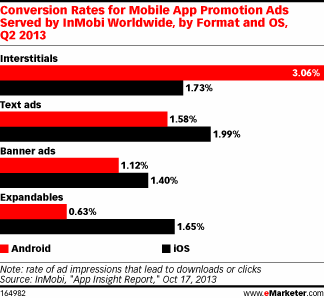
Read MoreConversion Rates For Mobile App Promotion Ads By Format & OS, Q2 2013 [CHART]
Interstitials advertising mobile apps garner a conversion rate of just over 3% on devices running Google’s Android operating system.
Read More