Posts Tagged ‘Cable Television’
US Political Ad Spending Allocations, 2012 vs 2016 [CHART]
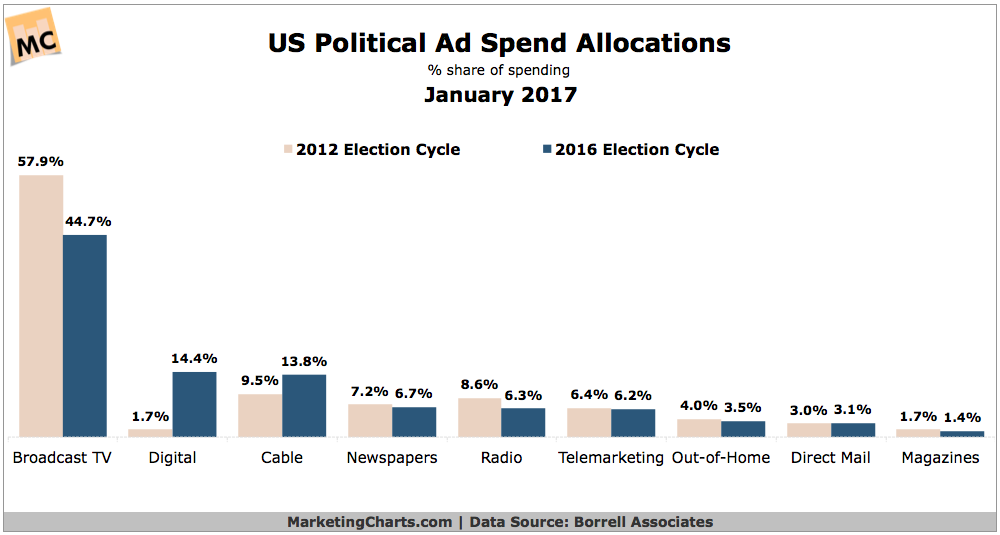
Political advertising reached $9.8 billion in the 2016 election year, marking a more than 4% increase from the 2012 election cycle ($9.4 billion) and representing a new record.
Read MoreUS Political Ad Spending By Format, 2008-2016 [TABLE]
While TV is still the dominant destination for political ad spend, spending on digital channels, is increasing the fastest year over year.
Read MoreHow People Research Political Candidates [CHART]
TV news and TV debates are still the primary ways in which US internet users research and learn about political candidates prior to elections.
Read MoreUS Ad Spending Trends
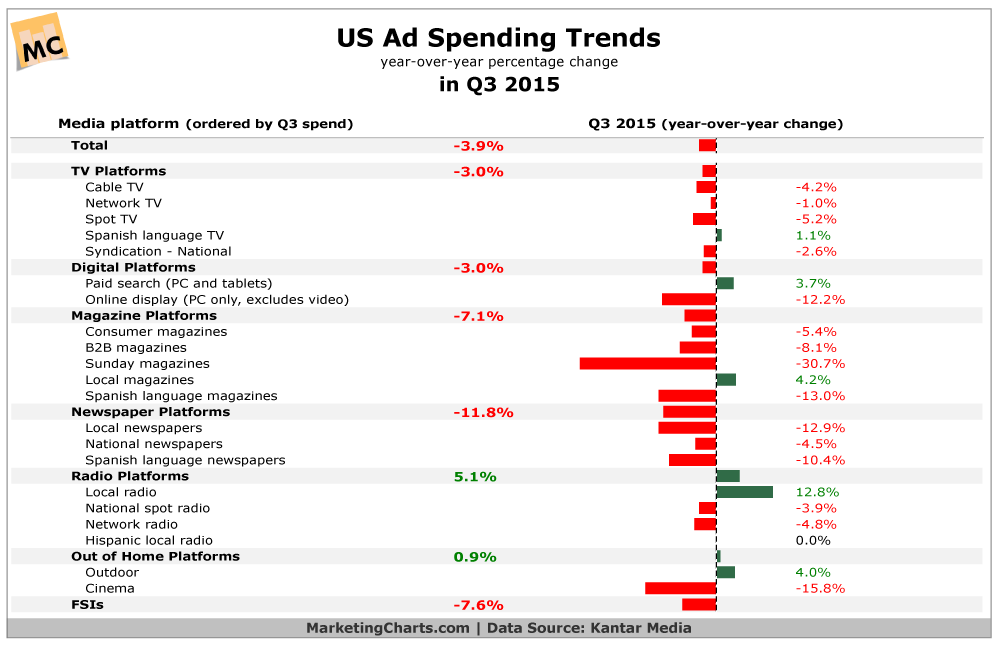
Advertiser spending on the media platforms tracked by Kantar Media declined by 3.9% in Q3, the same rate of decline as seen in Q2.
Read MoreOriginal Scripted TV Series By Provider, 2009-2015
The number of original scripted TV shows has grown over the years, not only on basic cable, but also on services like Hulu and Netflix.
Read MoreUS National vs State/Local Political Ad Spending By Media, 2015-2016 [TABLE]
Broadcast TV will boast the lion’s share of ad dollars, at nearly 52%, and the majority of those dollars will be spent on national campaigns.
Read MorePreferred Pay TV Subscription Model, 2012-2014 [CHART]
Those tied to a monthly cable or satellite package were interested in mixing it up—and taking more control over the content they were paying for.
Read MoreUS LGBT Media Consumption By Generation, August 2015 [TABLE]
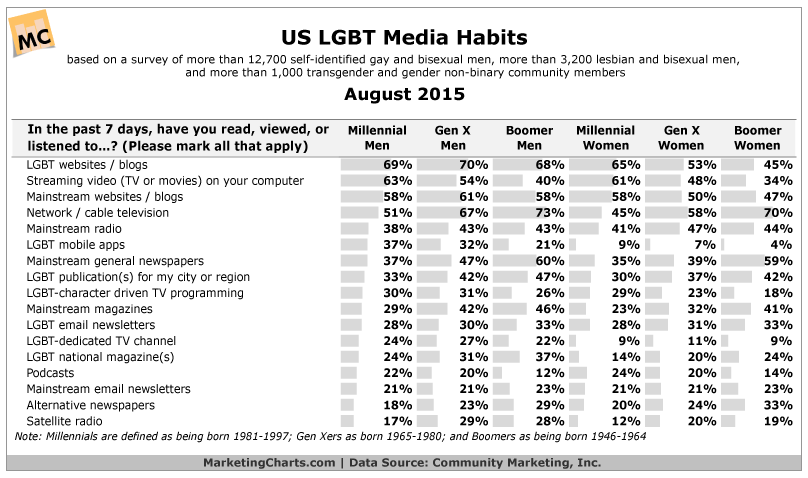
LGBT websites and blogs remain the most popular form of media among Millennial LGBTs.
Read MoreSocial TV Engagement Rates By Show Type, May 2015 [CHART]
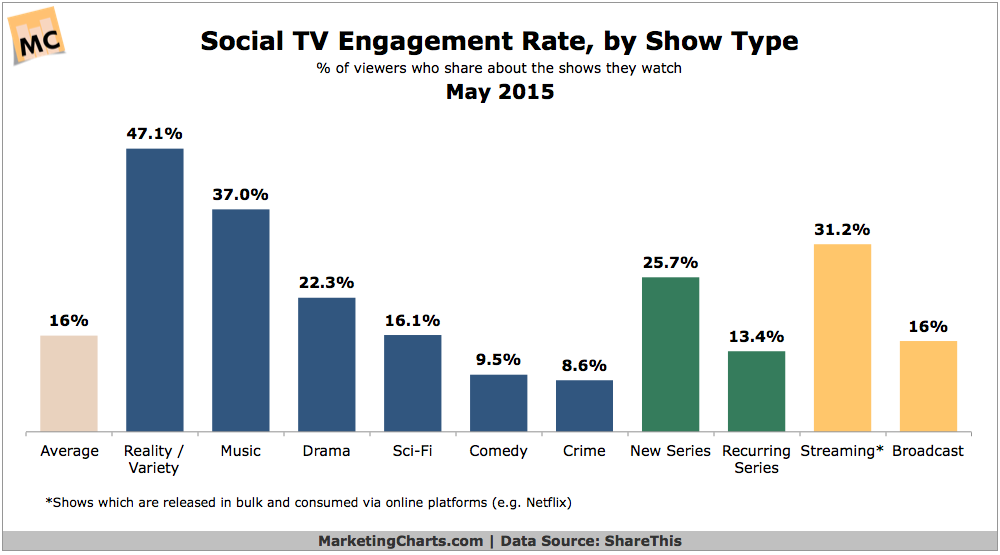
Some 16% of TV viewers on average share content about the shows they’re watching online, with these viewers driving an impressive 11% of all online sharing.
Read MoreSwearing Customers [INFOGRAPHIC]
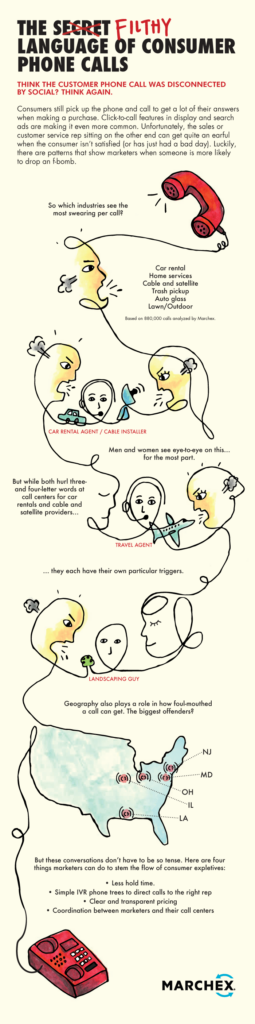
Swearing Customers Infographic: This infographic by Marchex illustrates the industries that earn the foulest-mouthed customers.
Read More