Posts Tagged ‘Beauty Marketing’
Expected Coronavirus Rebound By Retailer Category
Department Stores and off-price retailers are the most optimistic about recovering store traffic in the wake of the Coronavirus pandemic.
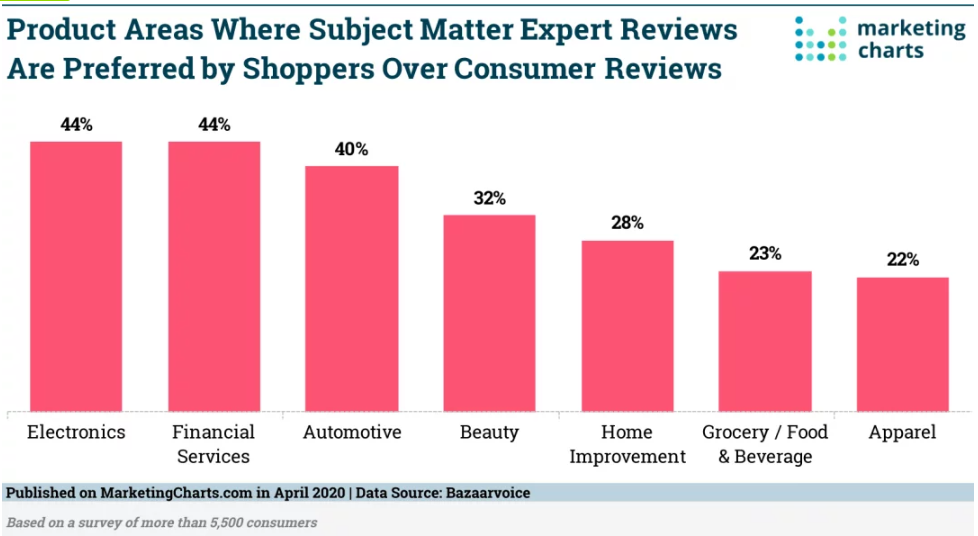
Read MoreSubject Matter Expert Review Value By Product Category
Consumers seeking reliable information about a product trust consumer reviews most – but this is not to say that online shoppers don’t value subject matter expert (SME) reviews for some product types.
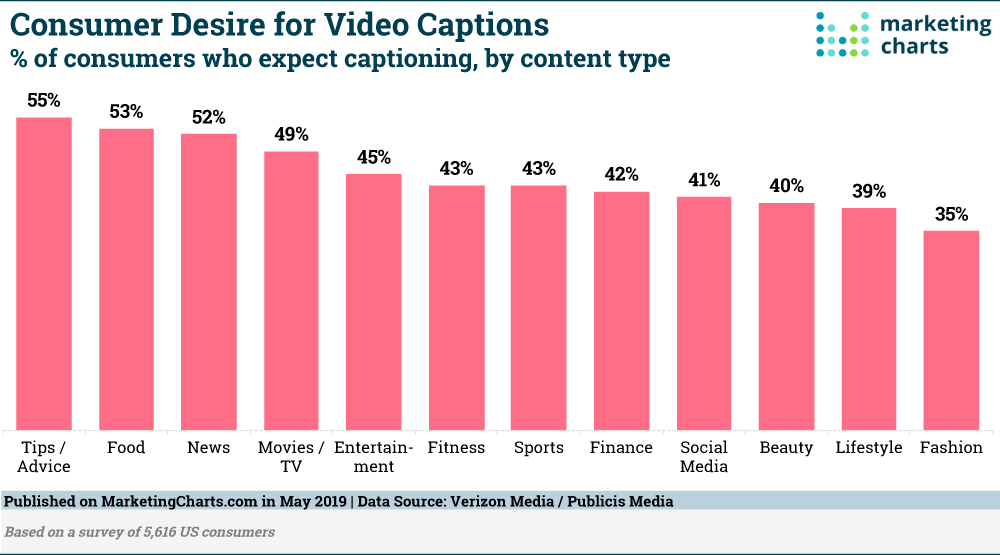
Read MoreVideo Captions Expectations By Industry [CHART]
Advertisers are increasing their video budgets this year, but are they missing out on one key element that could make a difference to audience engagement? A survey from Verizon Media has found that 7 in 10 (69%) US consumers watch videos without sound in public spaces, making captioning not only important but expected by viewers.
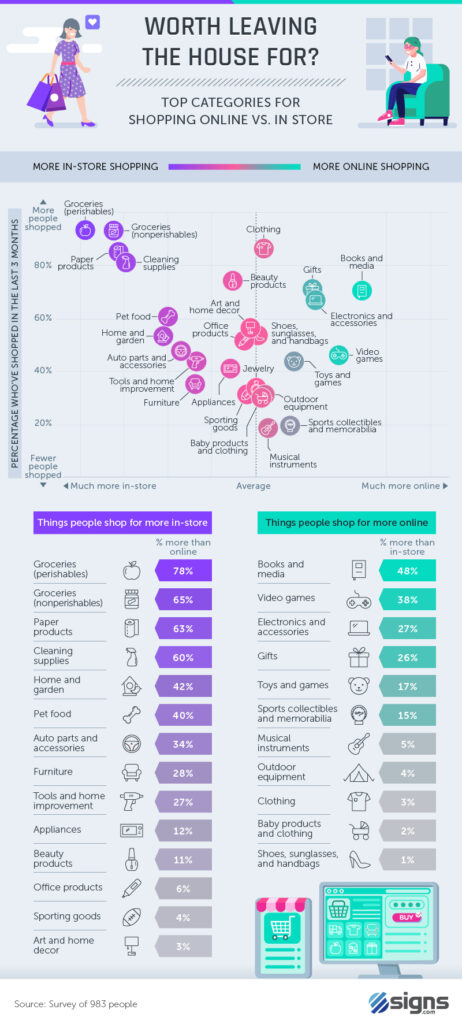
Read MoreTop Shopping Categories [INFOGRAPHIC]
This infographic from signs.com illustrates which retail shopping categories are most popular online versus in brick and mortar stores.
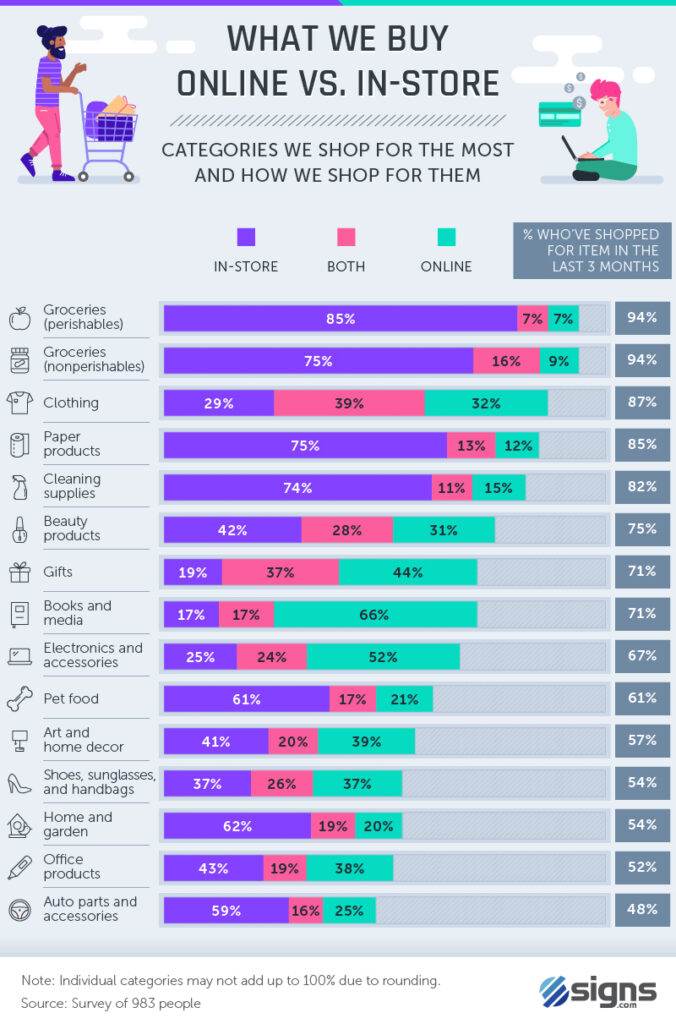
Read MoreShopping Online vs In-Store [INFOGRAPHIC]
This infographic from signs.com illustrates what people buy online, in-store, and both by 15 different categories.
Read MoreMobile Voice Search Behavior [INFOGRAPHIC]
This infographic from SERanking illustrates when, what, where, why and how of mobile search behavior.
Read MoreVoice Commerce Appeal By Product Categories [CHART]
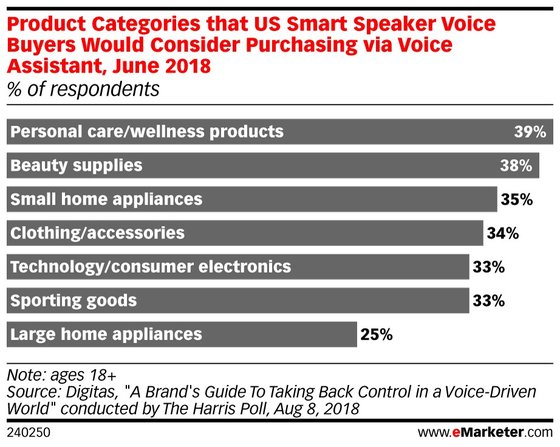
According to a Digitas survey, conducted by The Harris Poll, US smart speaker buyers are most receptive to buying personal care/wellness products (39%) and beauty supplies (38%) via voice commerce.
Read MoreAmazon Sales Growth By Retail Category [CHART]
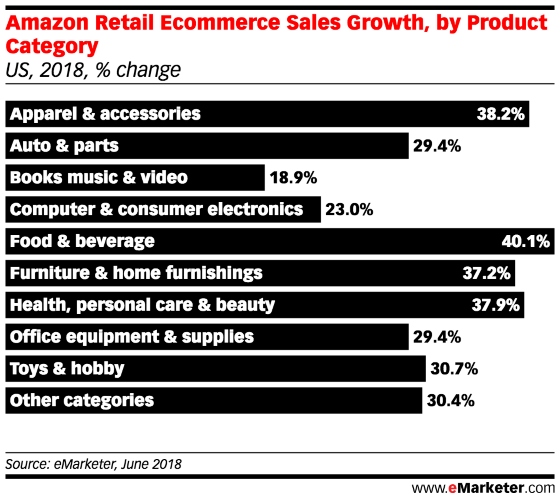
Food is one of the most underpenetrated digital sales categories in the US: eMarketer expects only 2.8% of food and beverage sales will occur online this year.
Read MoreInstagram Influence [INFOGRAPHIC]
This infographic from X-Cart illustrates the many ways in which Instagram is exerting its influence as a social media channel.
Read MoreFacebook Video Interactions By Topic [CHART]
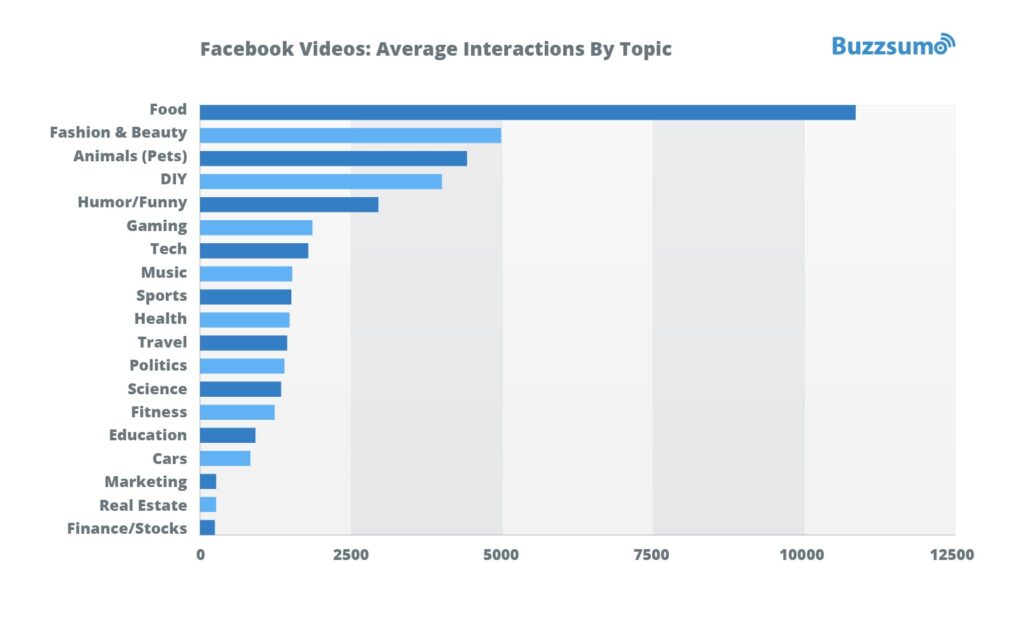
Buffer partnered with BuzzSumo to analyze more than 43 million posts from the top 20,000 brands on Facebook in one of the largest studies of 2018. The most enaging topics posted as video content to Facebook include food, fashion and beauty, animals, do-it-yourself, and humor. The least engaging topics include finance and stocks, real estate, marketing and cars.
Read More