Posts Tagged ‘AOL’
Internet Firsts [INFOGRAPHIC]
This infographic from SSLs.com highlights some of the milestones of internet history, from the first email to the first eCommerce transaction to the first tweet.
Read MoreThe History of Online Advertising [INFOGRAPHIC]
This infograph by PointRoll illustrates the history of online advertising.
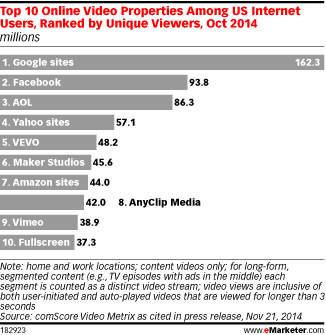
Read MoreTop 10 Video Properties By Unique Viewers, October 2014 [CHART]
YouTube captures nearly 20% of US video advertising spending right now.
Read MoreConsumer Perception Of Social Brands, October 2014 [CHART]
Google currently has the strongest brand health of the major social media sites measured with an Index score of 51.
Read MoreCreative Collaboration, 1960s-Present [INFOGRAPHIC]
This infographic from WebDAM illustrates the evolution of creative collaboration and how technological innovation has shaped that evolution.
Read MoreUs Online Ad Revenue Share By Company, 2012-2016 [TABLE]
Facebook’s share of the US digital display market rose from 14.8% in 2012 and is projected to hit 21.5% this year.
Read MoreTop 10 Online Video Properties, June 2014 [CHART]
Roughly 186.9 million Americans watched online content videos in June.
Read MoreCustomer Satisfaction Ratings For Portals & Search Engines, 2013 vs 2014 [CHART]
Customer satisfaction with internet portals and search engines improved by 4 points year-over-year to reach an index score of 80 (on a 100-point scale).
Read MoreGlobal Net Online Ad Revenue By Company, 2012-2014 [TABLE]
Microsoft will grow its net worldwide ad revenues by more than 20% over 2013 to reach $3.56 billion.
Read MoreNet US Online Ad Revenue Share By Company, 2012-2016 [TABLE]
Google alone already accounts for more than 10% of all advertising spending in the US.
Read More

