Visual Communications
Online Marketing Spending Increases In 2014 [CHART]
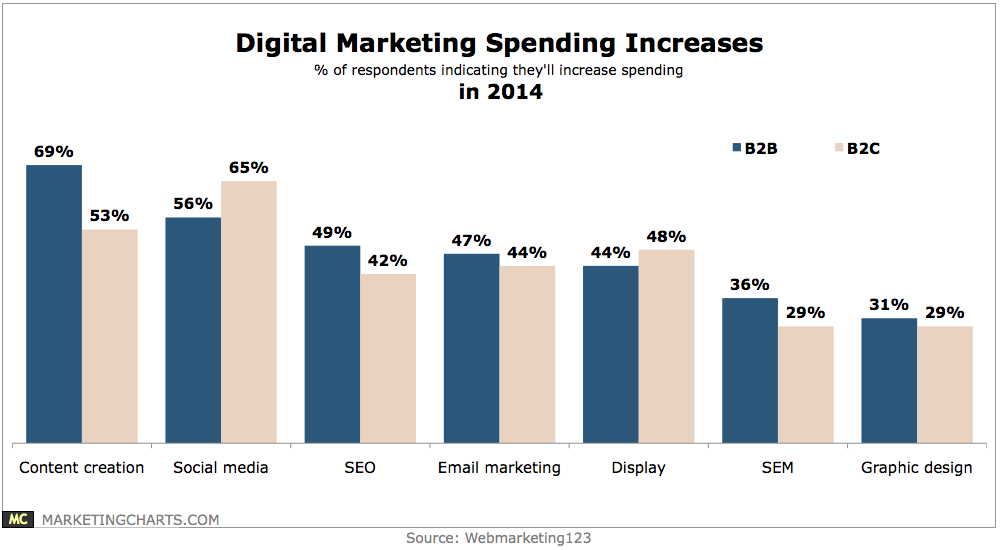
Content creation ranks as a top area for increased spending among B2B respondents, with 69% saying they’ll hike these budgets next year.
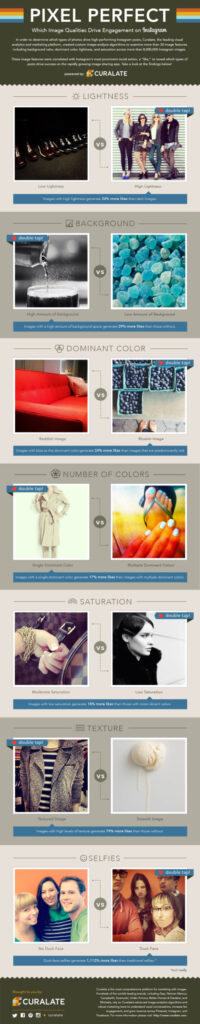
Read MoreVisual Analytics: Image Characteristics That Drive Use Behavior [VIDEO]
David Erickson discusses findings from visual analytics service Curulate that illustrate how differing image characteristics can drive user behavior on Instagram.
Read MoreTypes Of Content Marketers Share Online, August 2013 [TABLE]
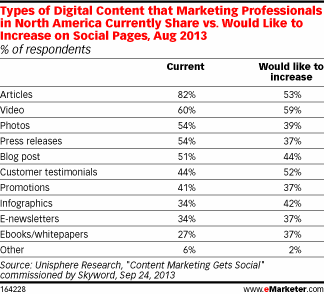
Nearly 60% of marketers would like to increase their video content in social networks – more than any other content category.
Read MoreSocial Sites Upon Which Agencies Plan To Run Video Ad Campaigns In 2014 [CHART]
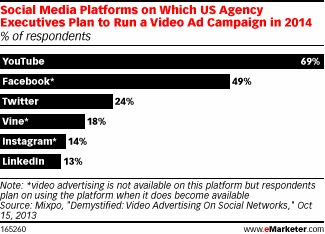
Nearly 70% of agency executives planned to advertise on YouTube in 2014, while nearly one-quarter expect to run video ads on Twitter and about one in seven on LinkedIn.
Read MoreTop 5 Channels For Sharing Content, Q3 2013 [CHART]
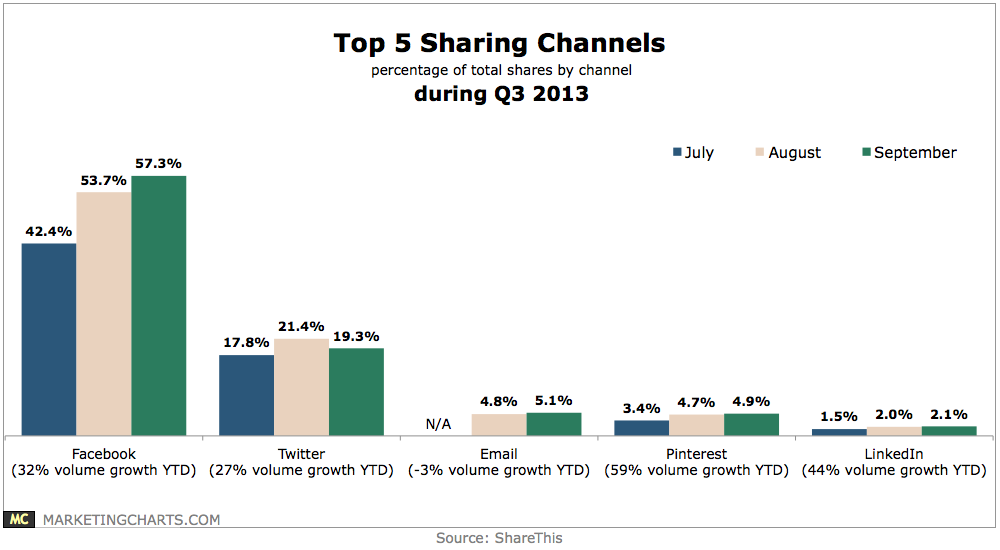
During September, Facebook accounted for a leading 57.3% of shares from websites that have the ShareThis tool embedded, significantly expanding its leading share from 42.4% a couple of months earlier in July.
Read MoreBlue Instagram Photos Attract More Likes [INFOGRAPHIC]
Instagram photos with blue as the main color got the most likes.
Read MoreTop Brands Adoption Of Instagram, October 2013 [CHART]
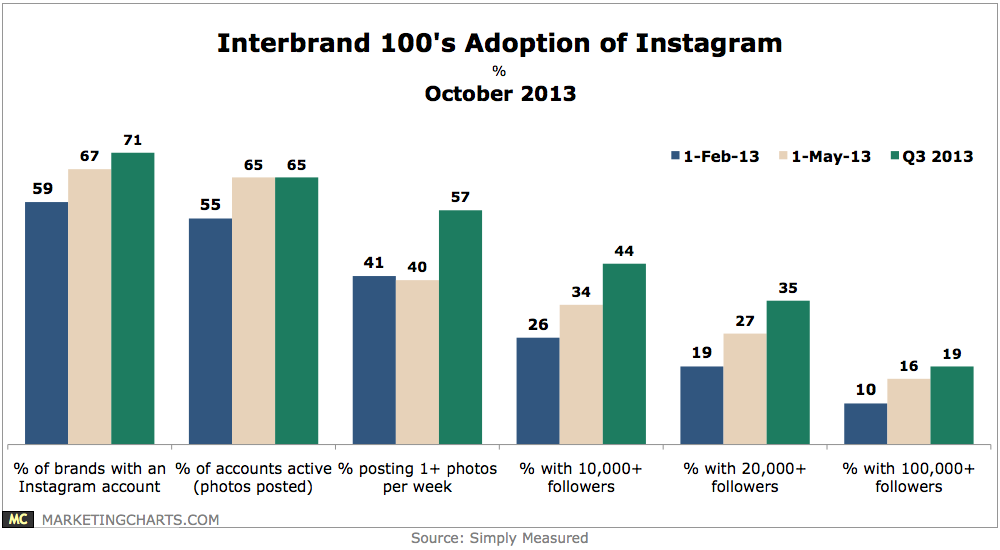
The number of top brands with an Instagram account has grown to 71 as of Q3 2013, up from 59 at the beginning of February and now rivaling adoption of Google+ (73) and Pinterest (74).
Read MoreRichie Incognito & The Miami Dolphins Hostile Workplace & A Poor PR Pitch – Beyond Social Media Show [VIDEO]

Topics on Beyond Social Media Show:Richie Incognito’s racism & workplace bullying in the Miami Dolphins locker room; Home Depot’s racist Tweet & more!
Read MoreSocial Engagement Rates By Post Types, Q3 2013 [CHART]
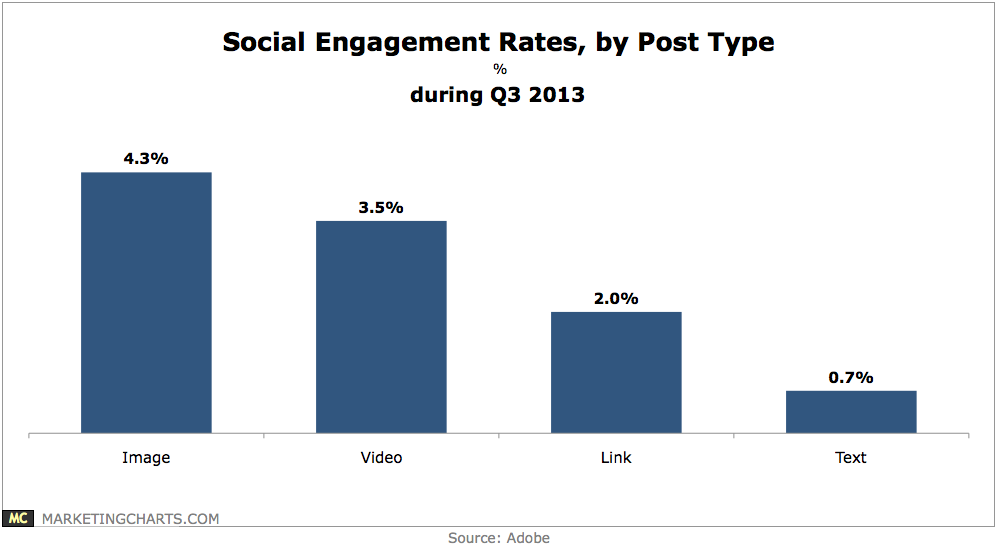
Likes account for the vast majority – 87% – of social engagement, but that share is inching back at the expense of comments and shares.
Read MoreRevenue Per Social Visit, 2012 & 2013 [CHART]
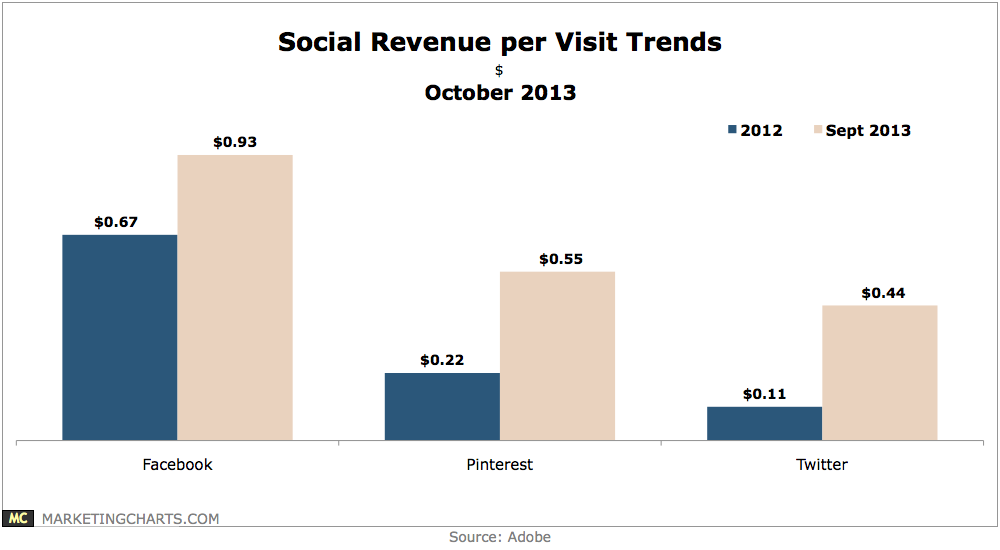
Revenue per visit grew 39% between 2012 and Q3 2013 for Facebook (to $0.93), while growing by 150% for Pinterest (to $0.55) and quadrupling for Twitter (to $0.44).
Read More