Visual Communications
Most Popular Smart Watch Apps By Gender, October 2014 [TABLE]
Most Popular Smart Watch Apps By Gender: Women liked social networking apps the best while men liked sports and gaming apps best.
Read MoreThe Color Of Marketing [INFOGRAPHIC]
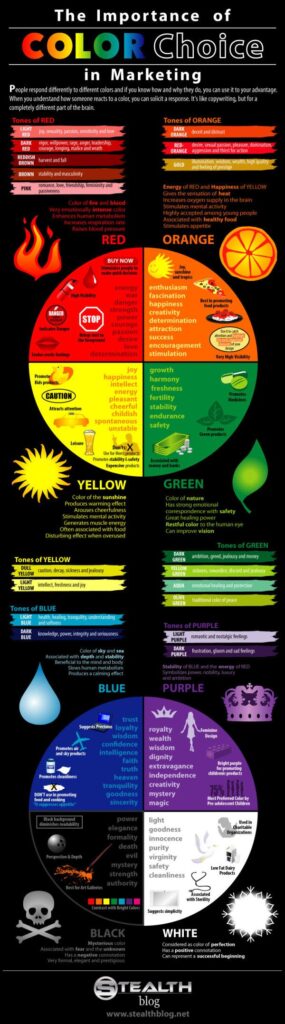
This infographic illustrates the psychological uses of color in marketing.
Read MoreSocial Sites That Ad Execs Have Used vs. Plan To Use For Video, December 2014 [TABLE]
Nearly nine in 10 US advertising executives polled said they planned to run a video ad campaign on Facebook in the coming year—the highest response rate out of all networks.
Read MoreSocial Network Usage Share By Site & Age, December 2014 [CHART]
This year, 95.0% of 18-to-24-year-old internet users in the US will log on to a social network via any device at least once per month.
Read MoreFrequency Of Prestige Brand Instagram Posts & Engagement, Q4 2013-Q4 2014 [TABLE]
Instagram presents brands with an audience that’s enthusiastic about engagement.
Read MoreBrand Adoption Of Instagram By Industry, Q1 2015 [CHART]
Brand Adoption of Instagram: Just 23% of US brands had an account on Instagram.
Read MoreFrequency With Which Millennials Check Social For News [TABLE]
57% of US millennials checked Facebook at least once a day to get news and information.
Read MoreSocial Networks For Finding Jobs, November 2014 [CHART]
Facebook was the most popular social network for job searching, followed by Twitter and LinkedIn.
Read MoreUnderstanding Web Graphics [INFOGRAPHIC]
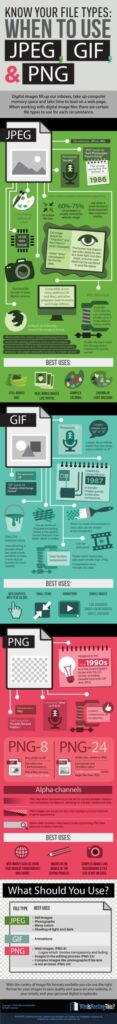
This infographic from Who Is Hosting This illustrates the differences and uses of the most common web graphic file types: JPG, Gif& PNG.
Read MoreFacebook Brand Post Interaction Rates, 2014 vs 2015 [CHART]
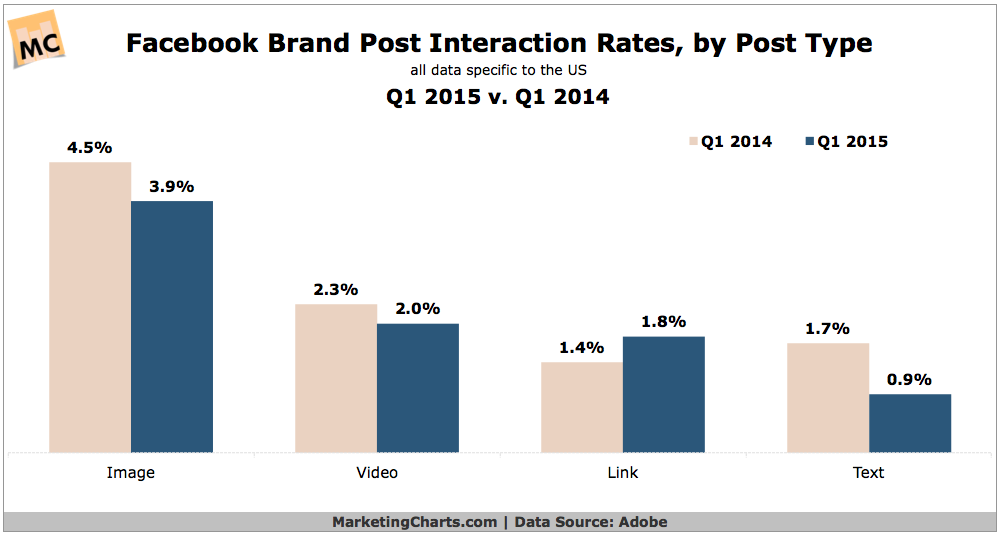
Algorithm changes enacted by Facebook in Q1 led to interaction rate declines across most post types.
Read More