Visual Communications
Social TV Behavior By Channel [CHART]
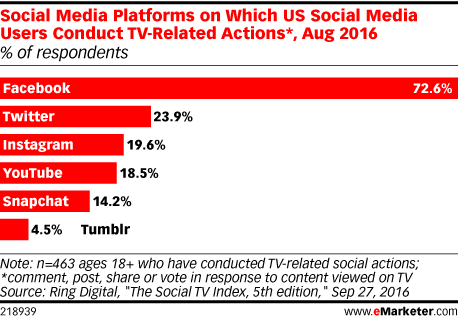
A majority of US social media users who comment, post, share or vote in response to content they view on TV do so on Facebook.
Read MoreLinkedIn Optimization [INFOGRAPHIC]
This infographic from Leisure Jobs illustrates seven aspects of LinkedIn optimization.
Read MoreMost Annoying Aspects Of B2C Marketing Emails [CHART]
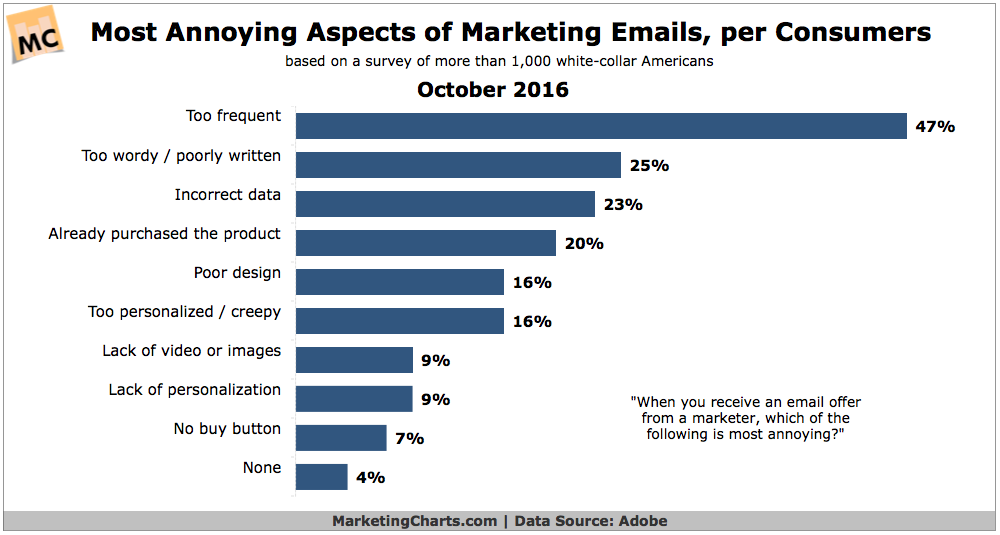
Among white-collar Americans, time spent with email is up 17% year-over-year, with Millennials (shock!) spending the most time with email.
Read MoreInstagram Stories vs Snapchat Stories [CHART]
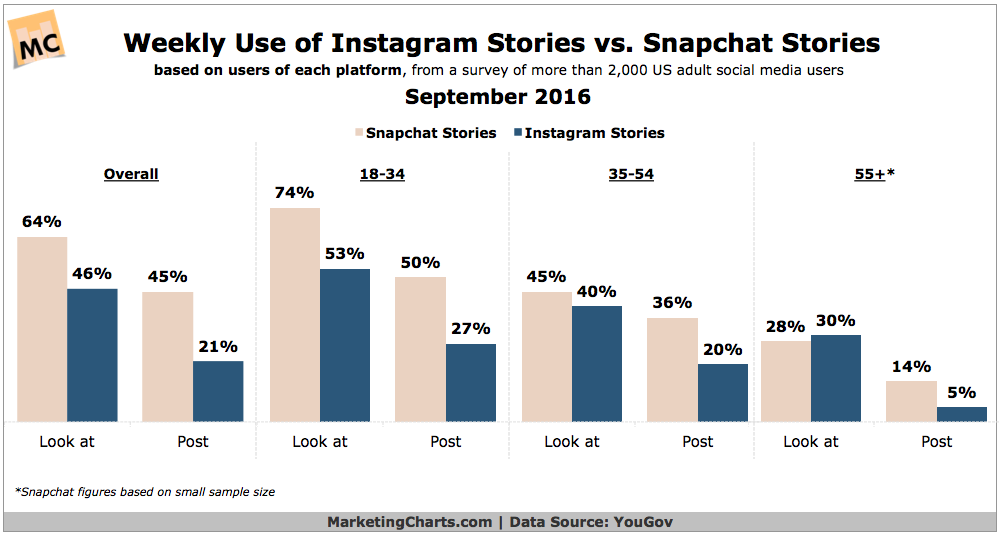
Snapchat users are more engaged with Snapchat Stories than Instagram users are with recently-launched Instagram Stories, and US adults who have used either would rather use Snapchat stories.
Read MoreTeen Internet Use By Platform [CHART]
The National Cyber Security Alliance and Microsoft polled 804 US teen internet users ages 13 to 17 about their digital activities.
Read MoreAmericans' Daily Social Media Use By Device [CHART]
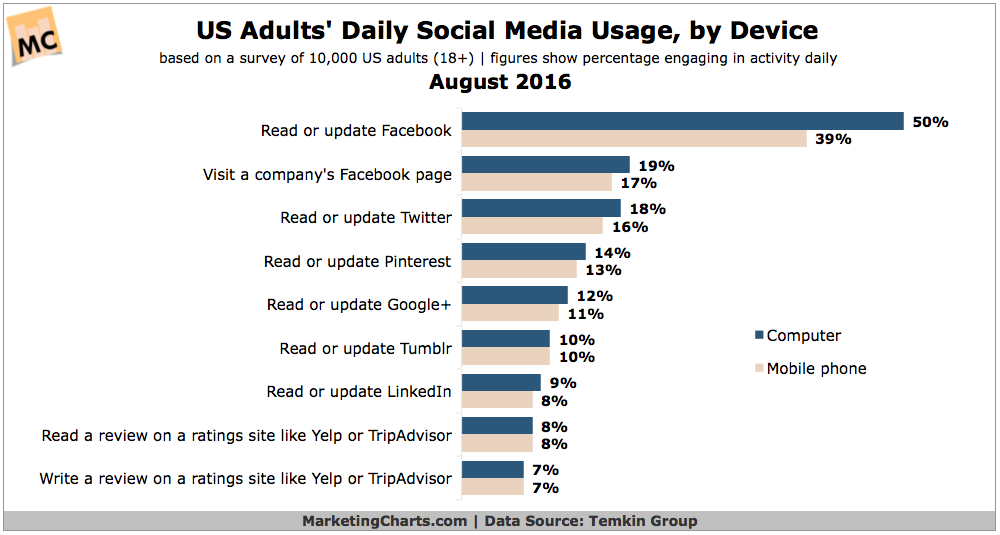
Some 19% of American adults visit a company’s Facebook page each day from a computer, and a similar proportion (17%) do so every day from their mobile phone.
Read MoreColor Psychology In Branding [INFOGRAPHIC]
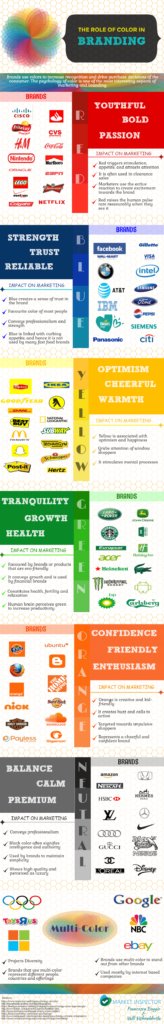
This infographic by Market Inspector examines six colors (red, blue, yellow, green, orange and black), brands that use them, and the psychological implications associated with those colors.
Read MoreSocial Network Users & Penetration By Plaftorm, 2015-2020 [TABLE]
By the end of 2016, 52.2 million people in the US will access their Twitter accounts at least once a month. That’s a 2.0% increase over last year.
Read MoreDemographics Of Pinterest Users

Roughly three-in-ten online Americans (31%) use Pinterest, identical to the 31% who used the platform in 2015.
Read MoreDemographics Of Instagram Users [TABLE]
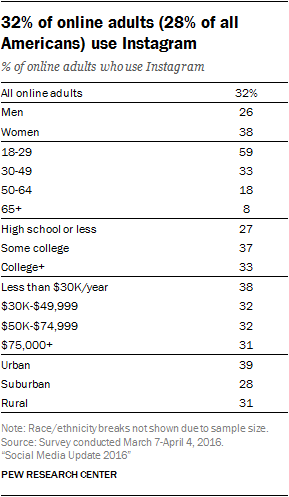
Around one-third of online adults (32%) report using Instagram – roughly the same share as in 2015, when 27% of online adults did so.
Read More