Video
Simultaneous Internet & TV Users, 2014-2018 [TABLE]
This year, 182.9 million Americans will use the internet while watching TV at least once a month.
Read MoreAttitudes Toward Political TV & Online Ads [CHART]
The presidential campaigns have had the most variation in ads served.
Read MoreTypes Of Online Harassment [INFOGRAPHIC]
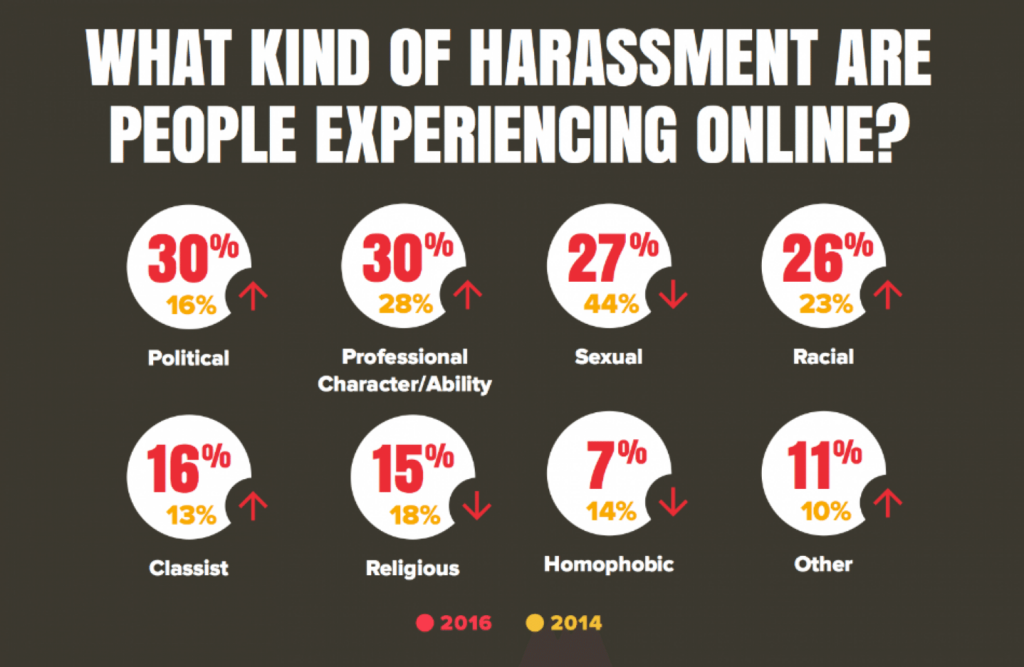
95 percent of all Americans consider incivility a problem. Seventy percent consider it a crisis, which is up from 65 percent in 2014.
Read MoreUS Coupon Use By Type & Generation [CHART]
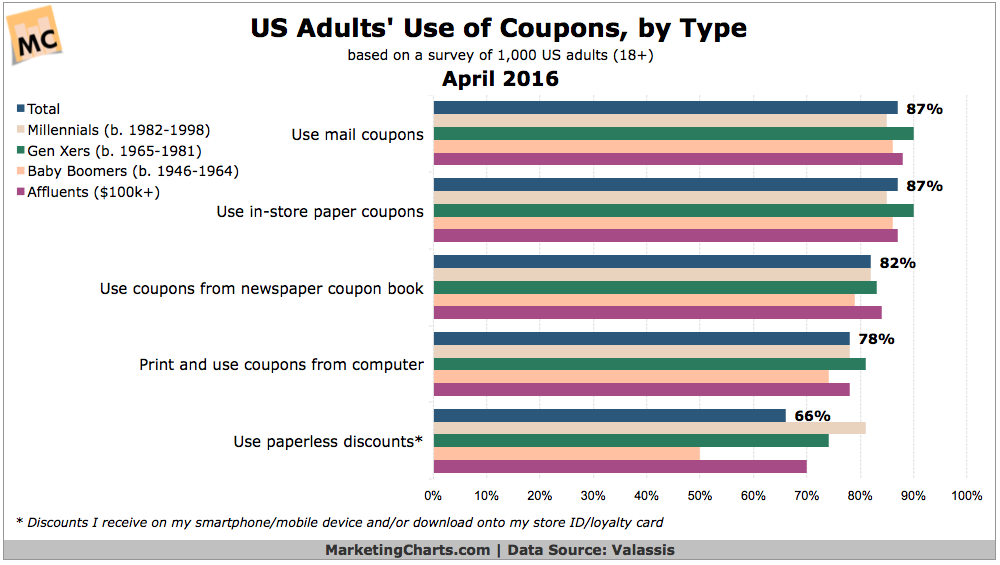
US adults are more likely to use print coupons than paperless discounts, a finding that is true across generations and extends to affluents.
Read MoreMultitainment Behavior By Generation [CHART]
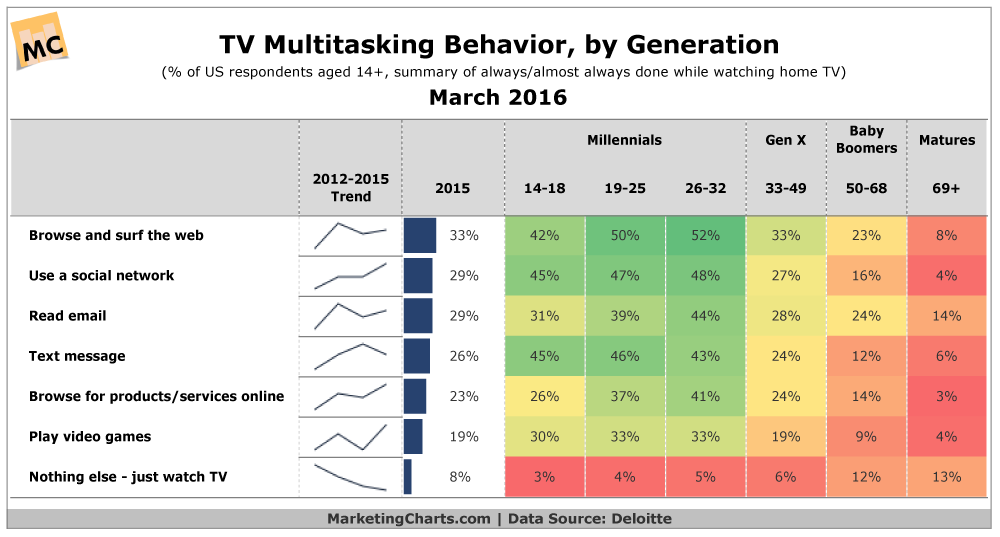
More than 9 in 10 US consumers aged 14 and older say they typically multitask while watching TV, up from about 8 in 10 just 3 years earlier.
Read MoreTop Purchase Influences By Generation [CHART]
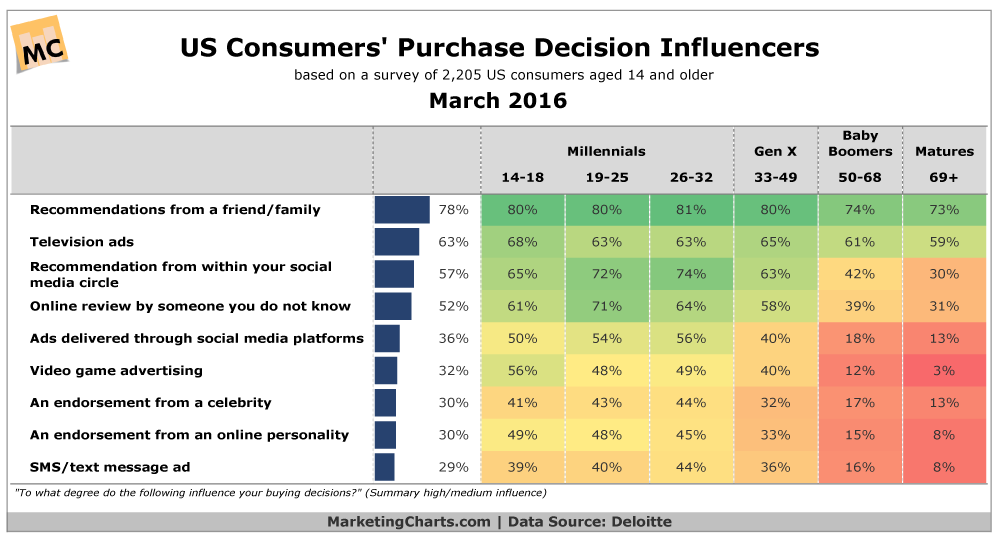
Word-of-mouth influences the purchases of more US consumers than TV ads, a finding that holds true across generations.
Read MoreConsumers' Preferred Brand Communication Channel [CHART]
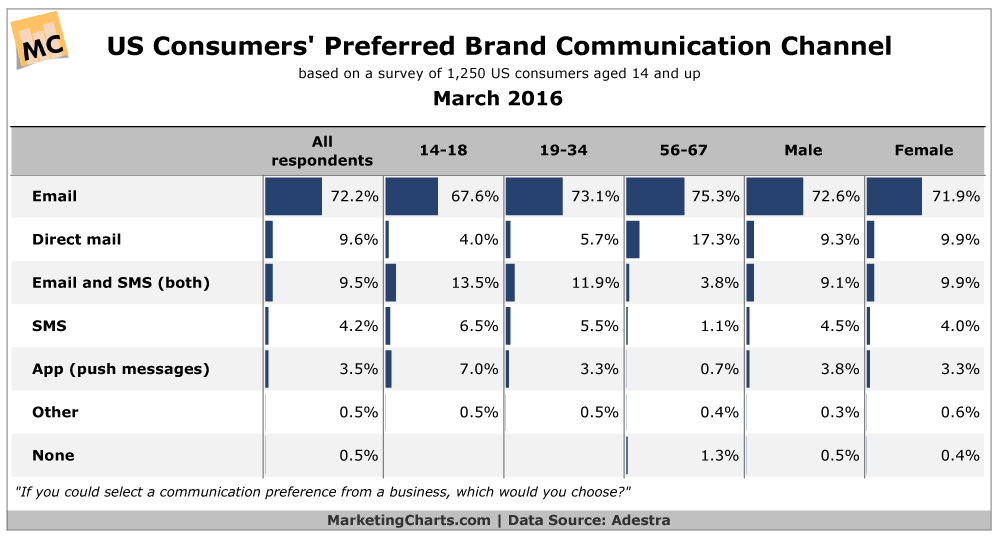
More than 7 in 10 US consumers would prefer to receive email communications from businesses.
Read MoreManaging Your Online Reputation [INFOGRAPHIC]
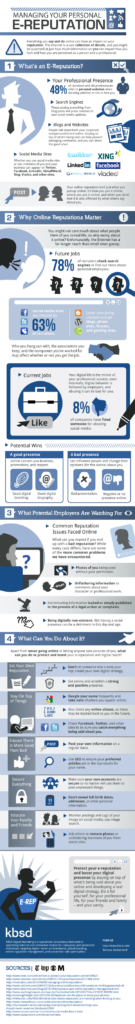
This infographic from KBSD illustrates how to manage your online reputation with facts, stats and tips.
Read MoreThe Fox News Effect [CHART]
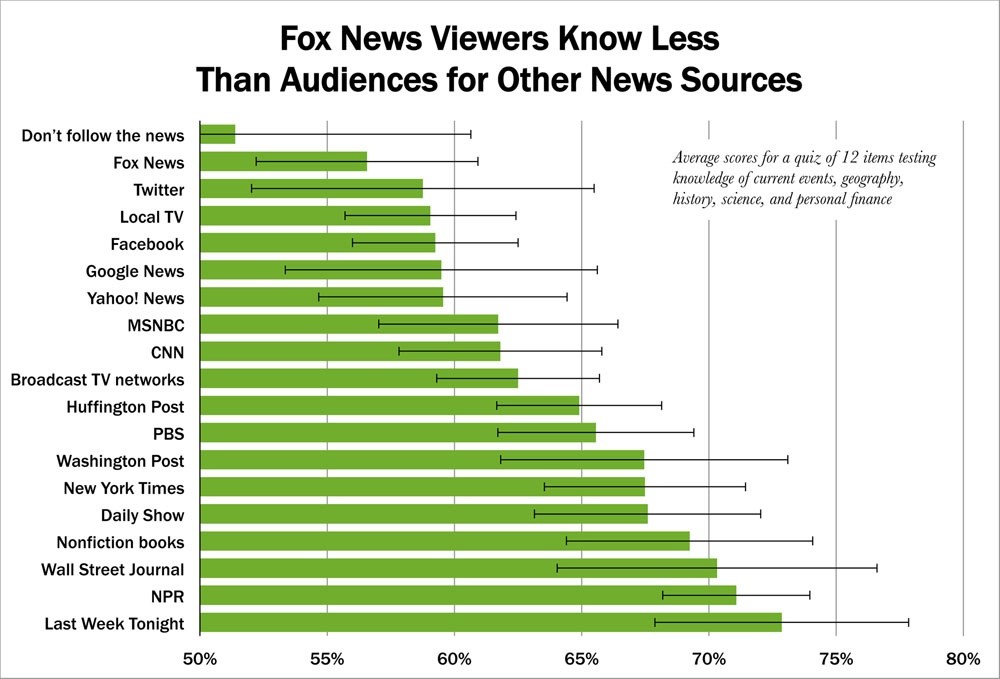
Fox News viewers scored the lowest of over 30 popular news sources (though Fox viewers did at least score better than those saying they didn’t follow the news).
Read MoreAmerican Sharing Economy Penetration, 2014-2020 [TABLE]
This year, 27.0 million US adults will use the sharing economy at least once.
Read More