Video
Attitudes Toward Using Video With VR [CHART]
Adoption of virtual reality (VR) headsets hasn’t grown by leaps and bounds.
Read MoreSharing Economy Growth, 2016-2021 [CHART]
As trust and familiarity with sharing economy services continues to grow, so too will the number of users.
Read MoreFrequency Of Smartphone Voice Input Use [CHART]
US smartphone users are more likely to use voice-enabled technology than those in the rest of the world.
Read MoreCustomer Experience Responses [CHART]
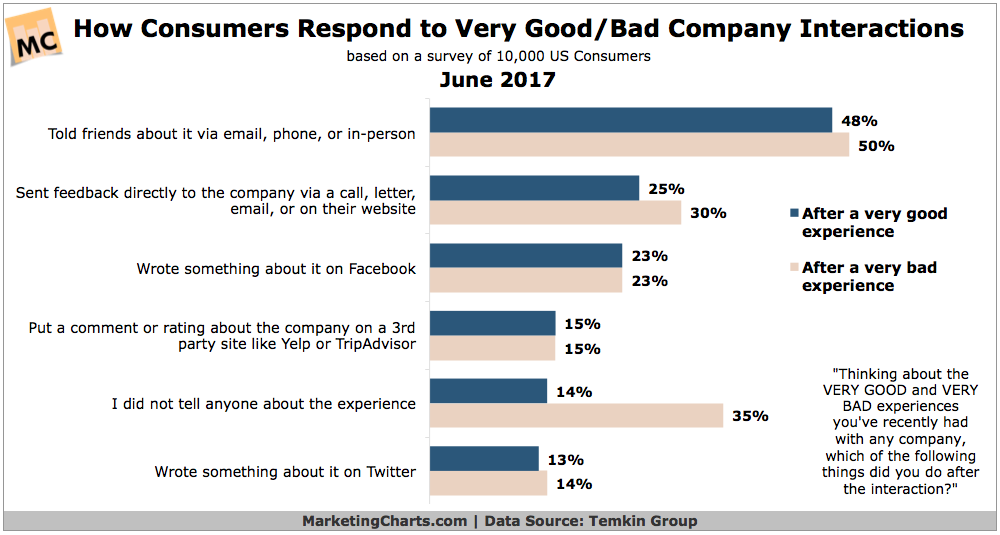
In a reversal from past research consumers are more likely to share good experiences than bad ones.
Read MoreUse Of Voice Search On TV [CHART]
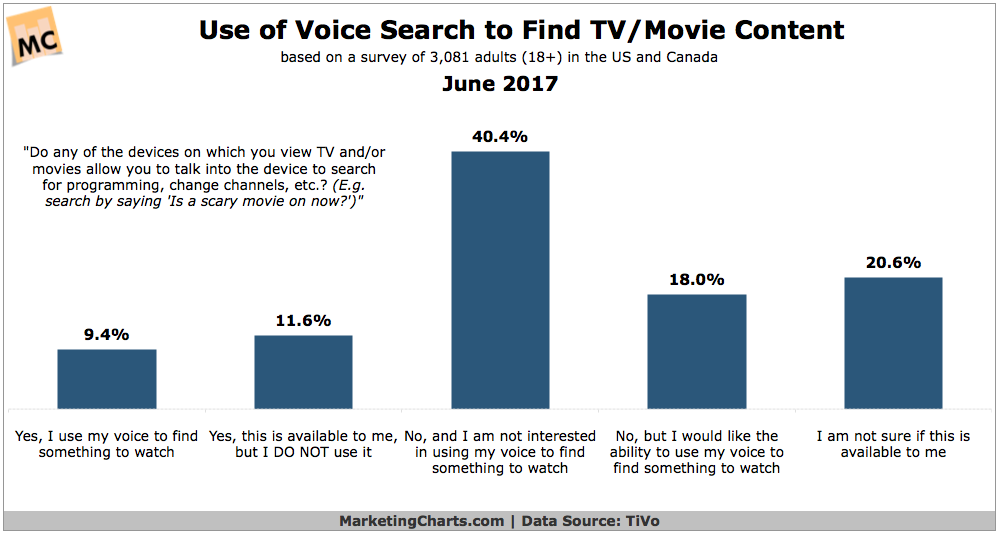
Voice-enabled assistants are becoming more popular, and are beginning to be used for digital commerce. But what about voice and TV?
Read MoreEmail Is The Most Important Piece Of B2C Data [CHART]
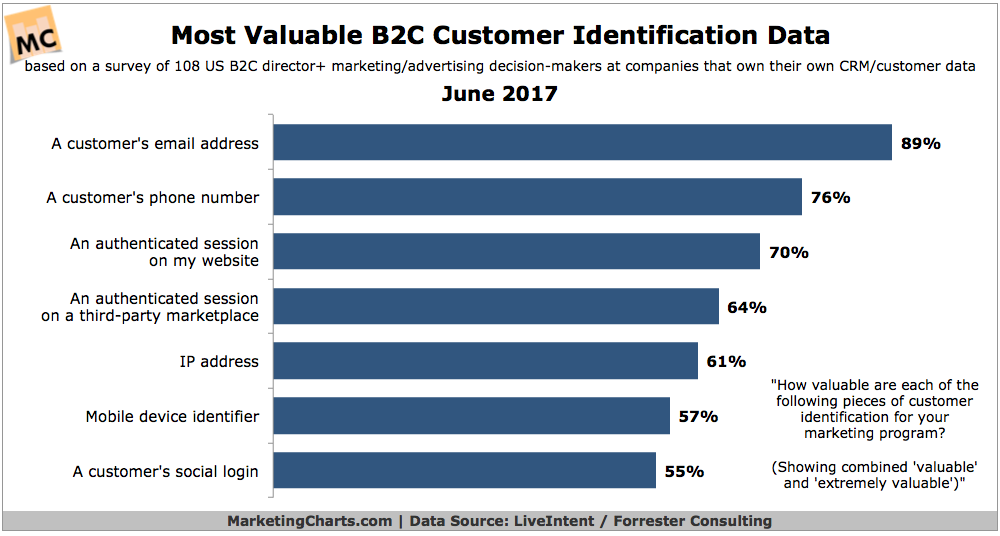
B2C decision-makers are more likely to see customers’ email addresses as valuable than their phone numbers or social logins.
Read MoreTop App Installation Marketing Methods [CHART]
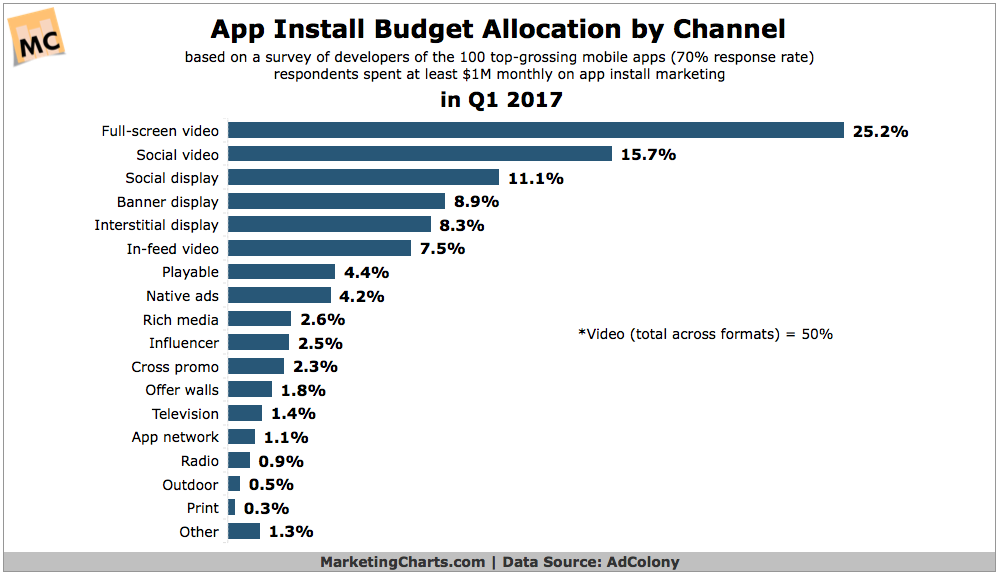
Video formats now account for half of all app install spending by developers of the 100 top-grossing apps.
Read MoreTop Referrers Of Mobile Traffic (After Facebook & Google) [CHART]
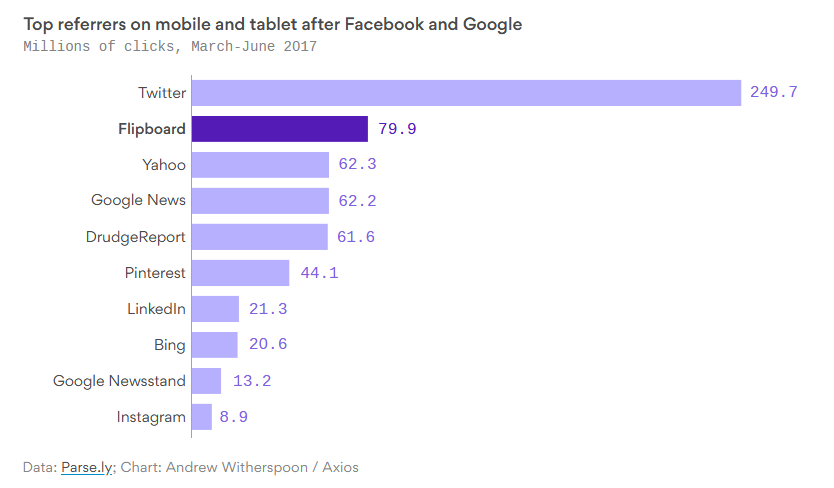
Flipboard is becoming one of the biggest drivers of traffic to news stories on mobile.
Read MoreConsumer Attitudes Toward Brands' Social Media Behavior [CHART]
Nearly seven in 10 US internet users surveyed by social media analytics and monitoring service Sprout Social in April 2017 were annoyed when brands used slang on social media.
Read MoreAd-Blocking Use, 2014-2018 [CHART]
More than a quarter of US internet users will block ads this year.
Read More