Video
Voice Assistant Use By Daypart [TABLE]
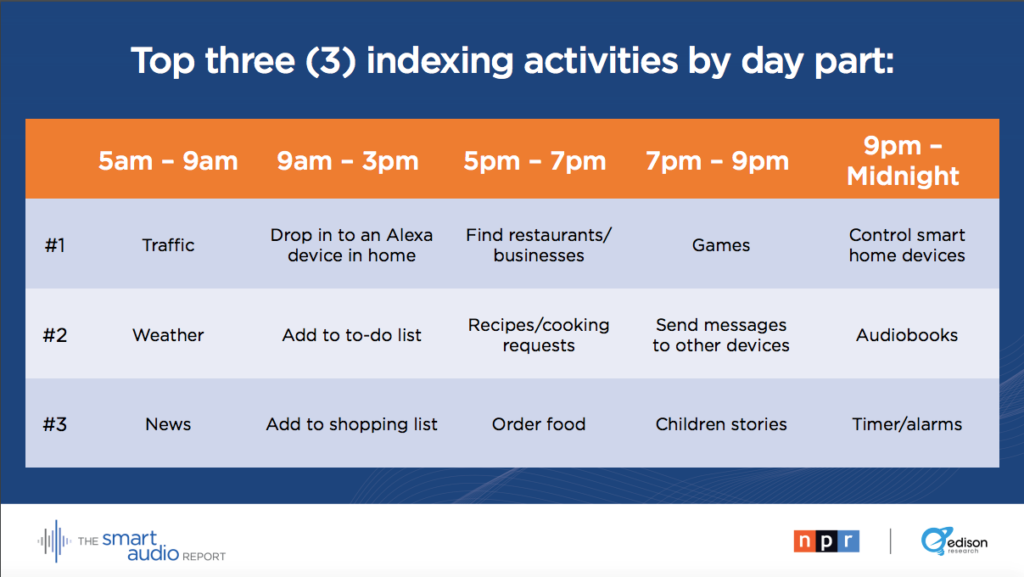
After a surge this past holiday season – when 4% of U.S. adults reported they acquired their first smart speaker device — ownership is up 128% since January 2017, to now one in six Americans (16%) having a smart speaker.
Read MoreVoice Activation [INFOGRAPHIC]
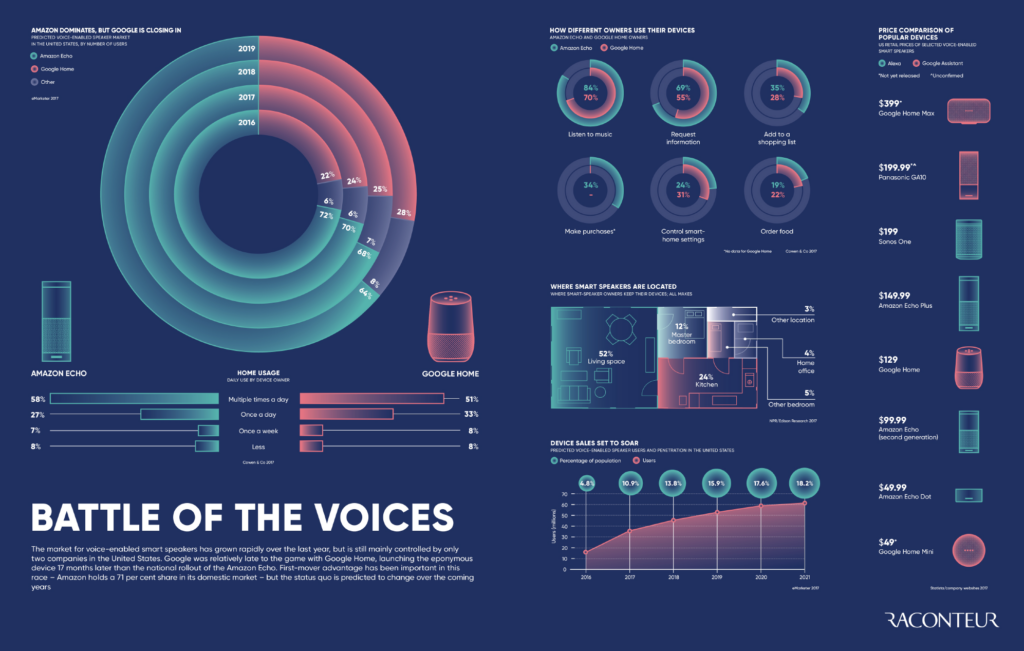
This infographic by Raconteur illustrates the competition over voice activation technology between Google and Amazon via their smart speaker products.
Read MoreWord-Of-Mouth Drives Consumer Sales [CHART]
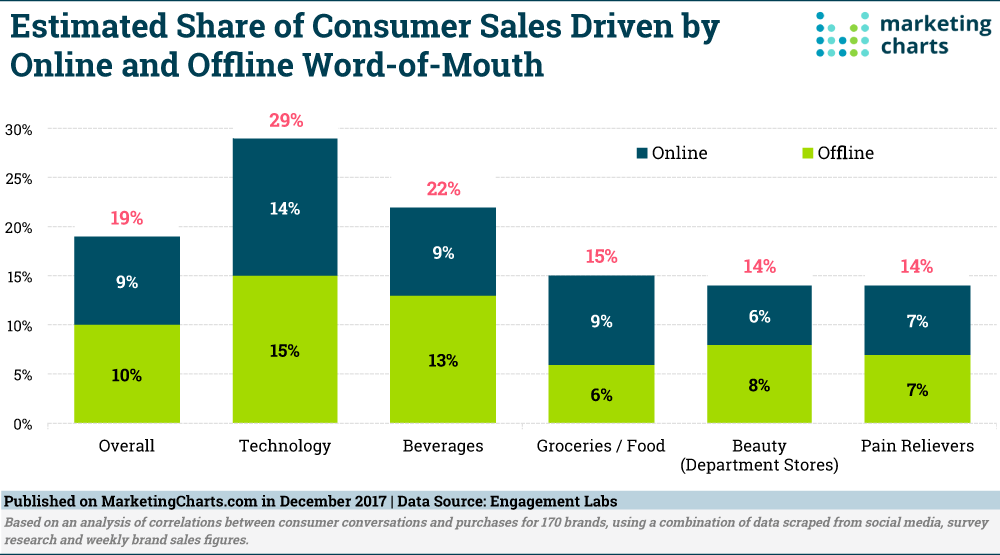
Word-of-mouth has time and again been shown in research to be the top influencer of consumer’s purchase decisions. Now, a new study from Engagement Labs quantifies the extent to which word-of-mouth drives sales, finding that an estimated 19% of consumers sales are the result of online and offline conversations.
Read MoreSnapchat-Only Users [CHART]
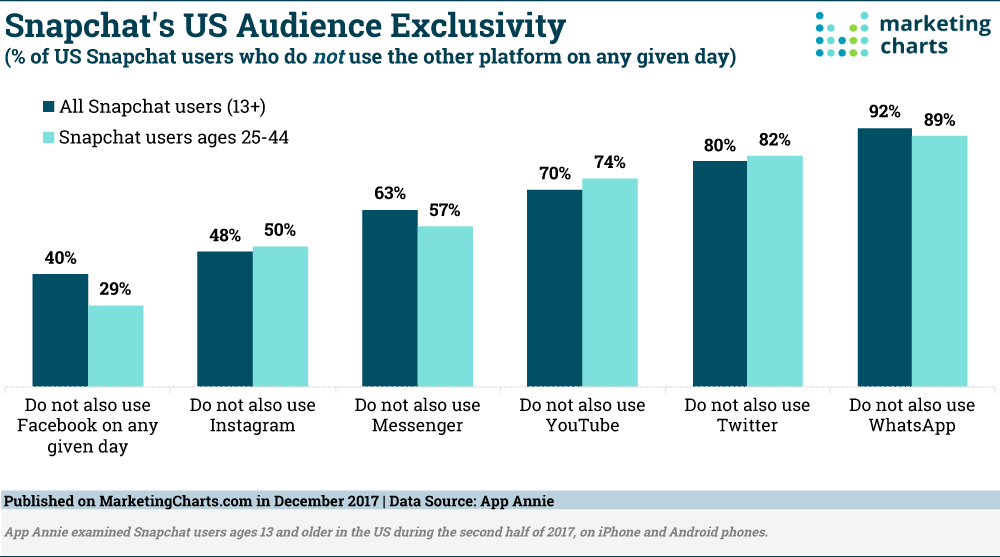
Research has suggested that only about 1 in 10 teen Snapchat users are unique to the platform and not also using Instagram. But to what extent do Snapchat users use other social platforms on a given day?
Read MorePodcast Listeners On LinkedIn By Age [CHART]
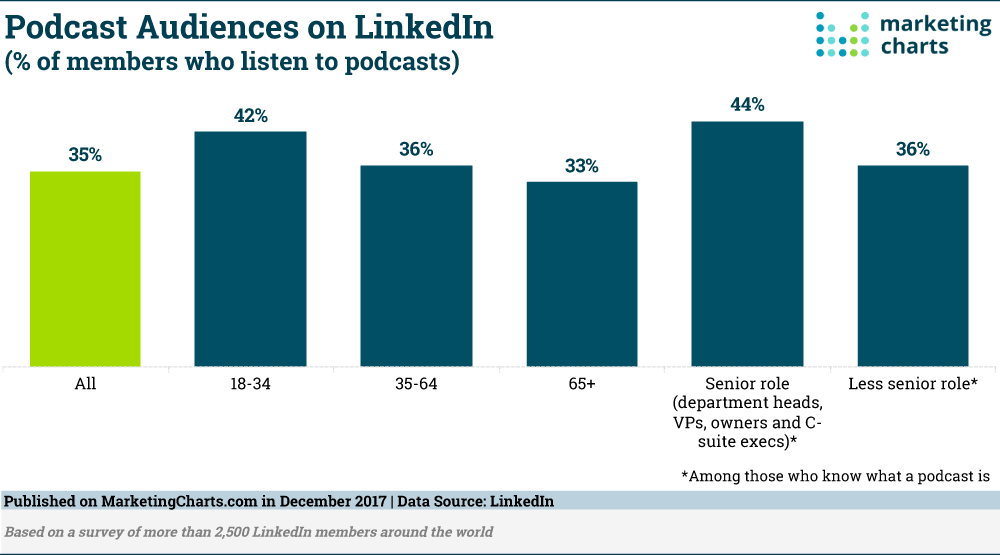
More than one-third (35%) of LinkedIn members around the world listen to podcasts, and fewer than 1 in 10 (8%) don’t know what a podcast is, according to results from a LinkedIn survey of more than 2,500 members.
Read MoreMost Important Customer Service Options For Online Shopping [CHART]
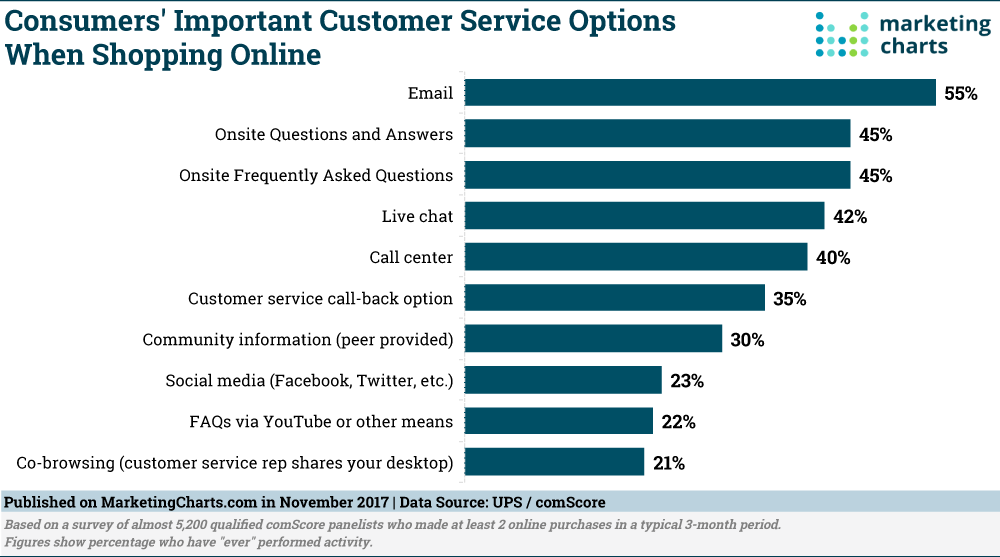
Online shoppers are increasingly taking advantage of live chat options when shopping online, reports UPS in the 5th installment of its 2017 Pulse of the Online Shopper research series. Some 42% see live chat as an important customer service option when shopping online, according to the study.
Read MoreMobile Share Of eCommerce Spending By Category [CHART]
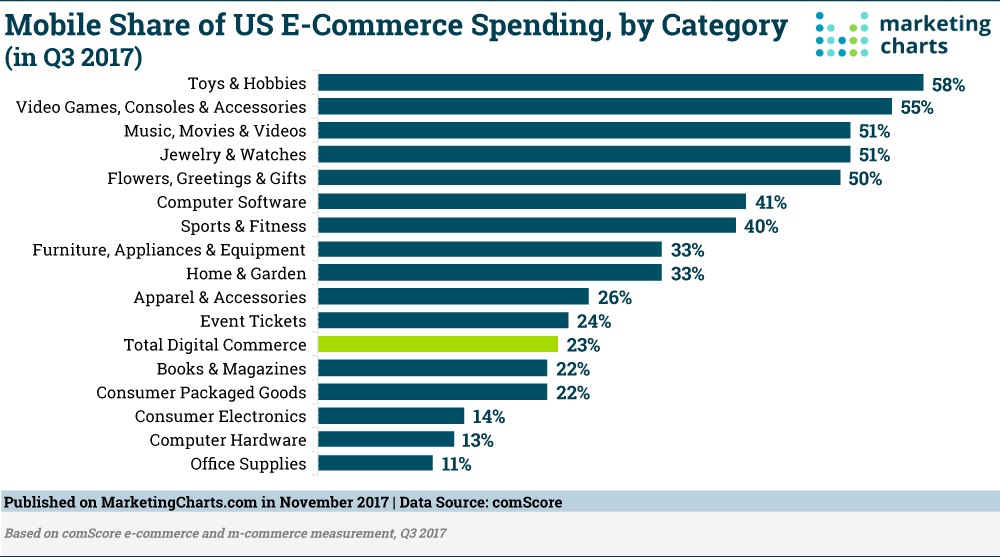
Mobile commerce has grown to represent 23% of all digital commerce dollars in the US in Q3 2017. That’s up from 20% share in the year-earlier period, as mobile commerce growth (+40% year-over-year) continues to far outpace desktop e-commerce spending increases (+17%).
Read MoreMarketers' Attitudes Toward AI [INFOGRAPHIC]
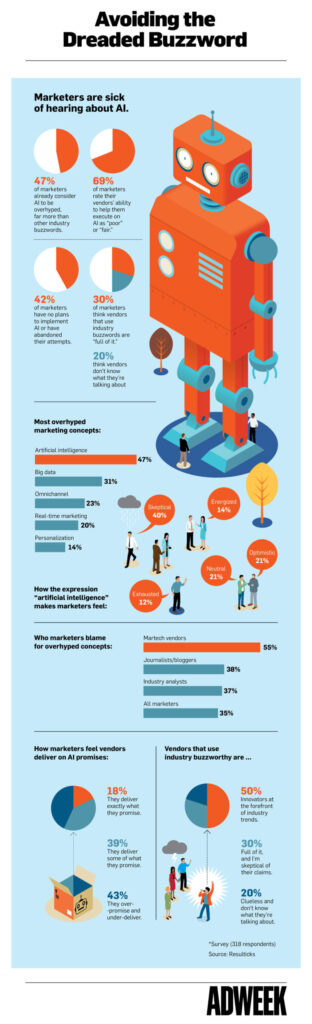
Almost half (47 percent) of marketers consider AI to be overhyped, far more than other industry buzzwords, while 43 percent of marketers believe vendors overpromise and underdeliver when it comes to AI.
Read MoreUsers Of Streaming Video Services By Provider, 2015-2020 [CHART]
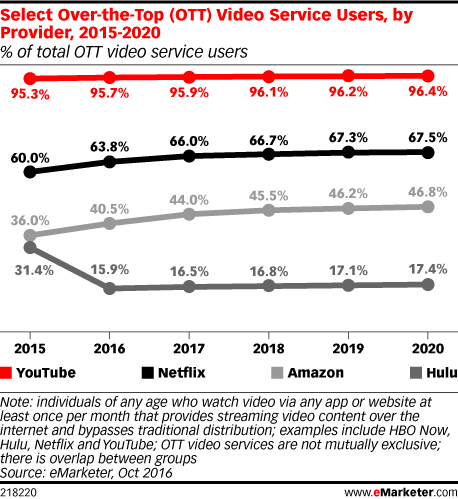
Despite an increasingly competitive digital video space that is packed with new (and successful) properties, usage of YouTube remains strong and the unit continues to be an important part of parent company Alphabet’s portfolio.
Read MoreReasons For Cart Abandonment [CHART]
Cart abandonment is a major concern for online retailers, and according to new research, shipping costs and overall price are the two major factors that are causing digital shoppers to abandon their items.
Read More