Video
Average Global Hotel Website Pageviews/Visit by Device, Q4 2012 [CHART]
Tablet users spent much more time on hotel websites, viewing an average of 4.9 pages per visit in Q4 2012, approximately the same as PC users.
Read MoreGlobal Hotel Website Visits By Device, Q4 2012 [CHART]
Google predicted that US hotel searches would be up 24% in 2013 overall, but that includes a 68% uptick in searches from mobile devices against a 4% decrease in desktop queries.
Read MoreHow People Find Websites, 2011 vs. 2012 [CHART]
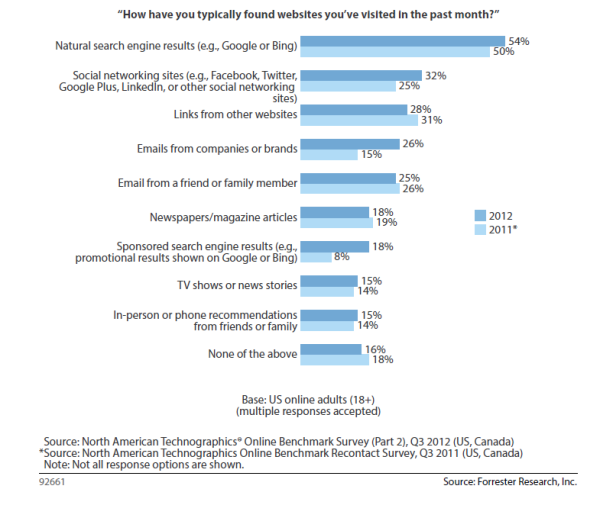
54% of respondents found websites through natural search results in 2012, up from 50% in 2011.
Read MoreFirst Person Point Of View Home Movies: Disneyland Through Google Glass [VIDEO]

Joe’s Daily compiled video clips taken via Google Glass during a vacation to Disneyland in California: One aspect of Glass that will have mass consumer appeal.
Read MoreWhy People Watch A Particular Television Show, June 2013 [CHART]
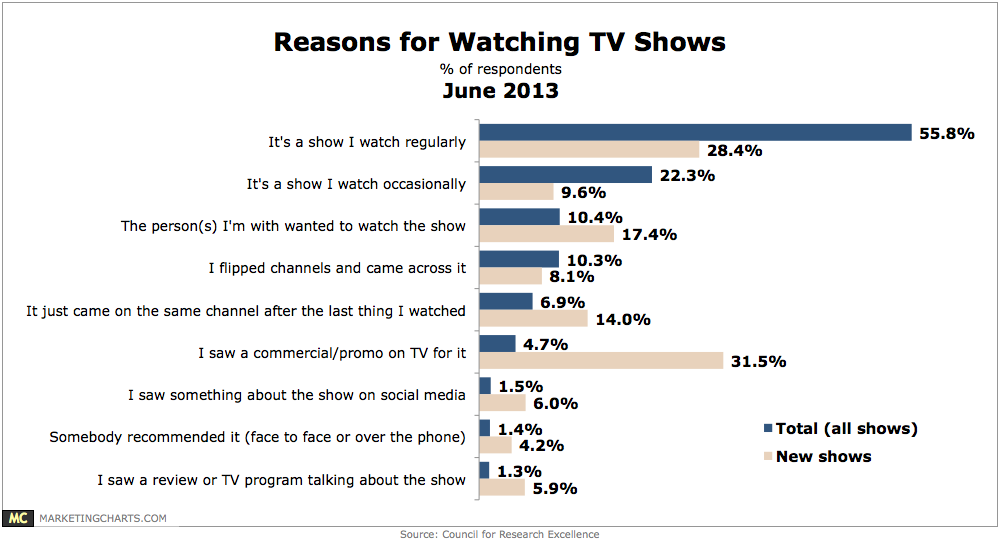
The proportion of study respondents who interact with TV-related content on social media on at least a weekly basis is triple those who do so on a daily basis (37% vs. 12%).
Read MoreAmerican Tablet Adoption Rates By Demographic, May 2013 [CHART]
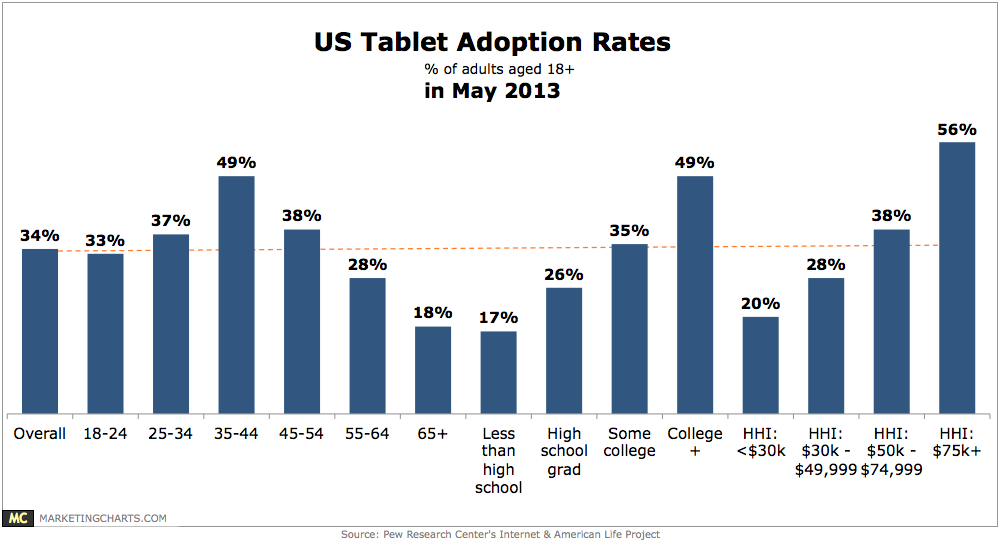
Pew’s Internet & American Life Project found 34% of American adults reporting ownership of a tablet, almost double the 18% adoption rate it found in a survey fielded in April 2012.
Read MoreFather’s Day Spending, 2007-2013 [CHART]
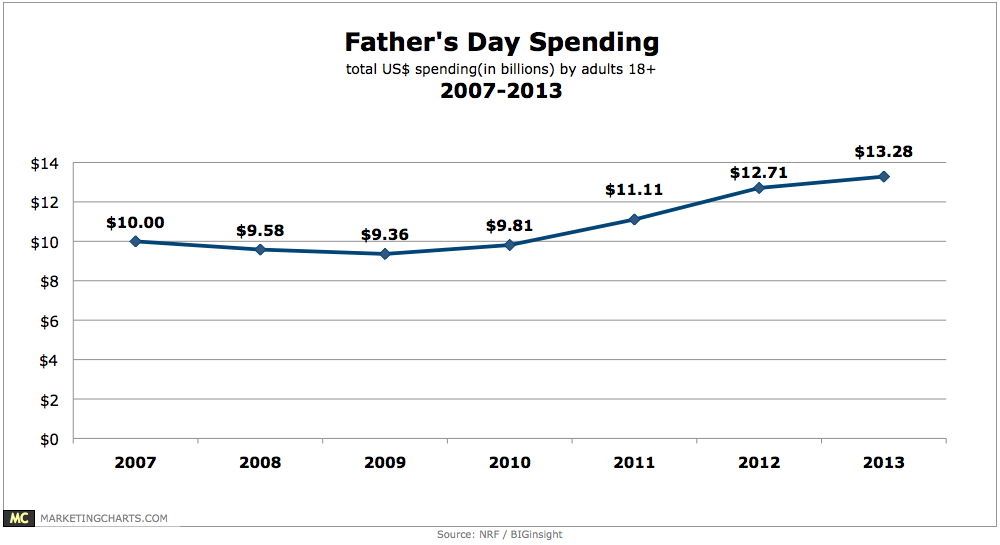
Total US spending related to Father’s Day (Sunday, June 16, 2013) should reach almost $13.3 billion in 2013.
Read MoreDemographics Of Social Media Users By Network, October 2012 [TABLE]
Mobile will be the dominant platform to reach US millennials for the foreseeable future.
Read MoreDemographics Of Auto Website Visitors, June 2012 [CHART]
The 18-to-34-year-old segment still makes up a large portion of digital automotive media consumption.
Read MoreAmerican New-Vehicle Registrations By Generation, 2001-2012 [CHART]
In 2001, 18- to 34-year-olds registered 24% of all new vehicles in the US; by 2012, that figure had dropped to 13%.
Read More