Video
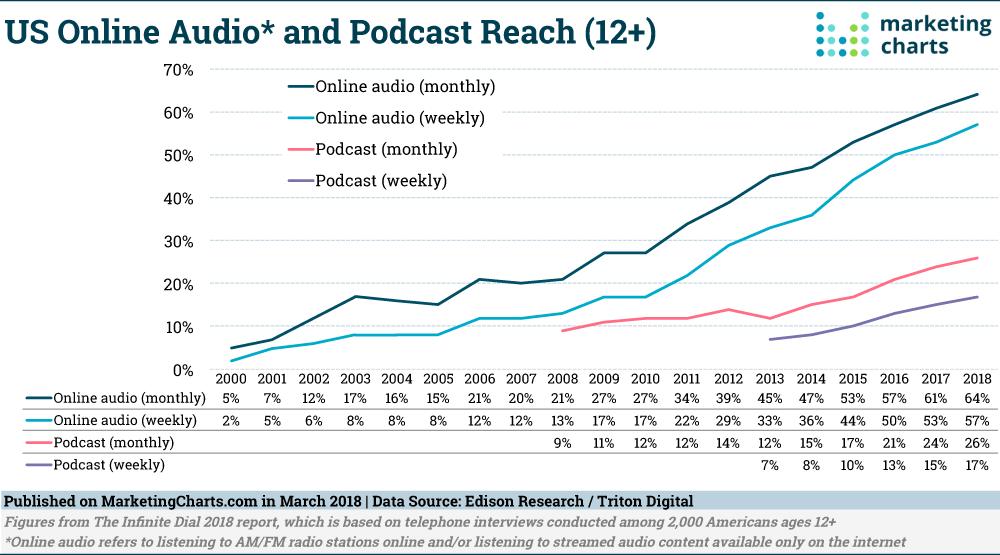
Online Audio vs Podcast Reach, 2000-2018 [CHART]
The popularity of online audio continues to rise. Some 64% of Americans aged 12 and older this year report listening to online audio on a monthly basis, and 89% of those listeners (57% of respondents overall) listen on a weekly basis.
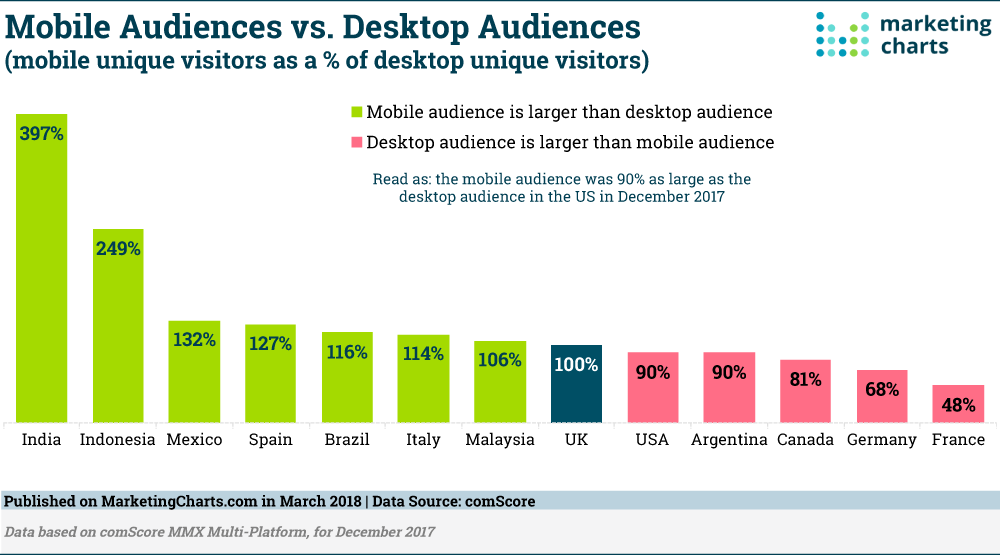
Read MoreMobile vs. Desktop Audiences [CHART]
Website visits are plateauing in the US – and the battle for visitors is increasingly being fought on smartphones. But despite mobile devices capturing the majority of digital minutes, the US still features more desktop than mobile unique visitors.
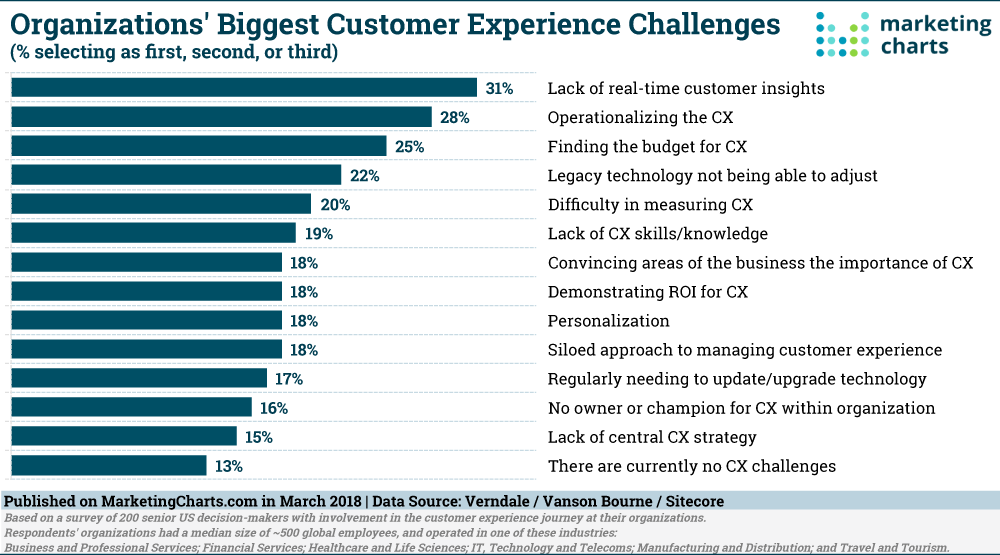
Read MoreTop Customer Experience Challenges [CHART]
Customer experience (CX) efforts aren’t primarily being held back by lack of strategy or organizational support, but rather from a lack of real-time customer insights and troubles operationalizing the experience.
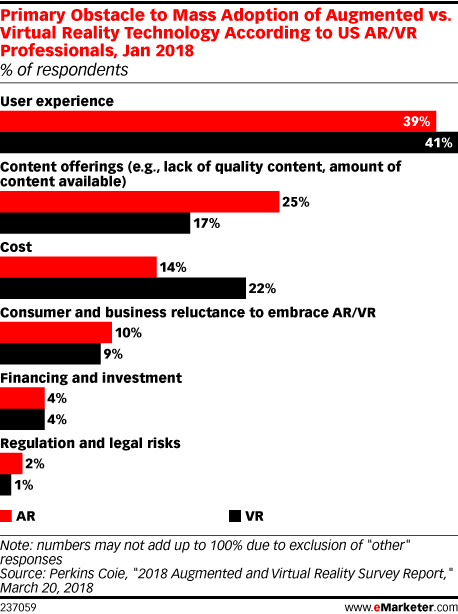
Read MoreObstacles To Augmented/Virtual Reality Adoption [CHART]
Interest in augmented reality (AR) and virtual reality (VR) has been hyped for some time, but the tech hasn’t reached mass adoption. Cost is certainly a factor, but it’s not the only one.
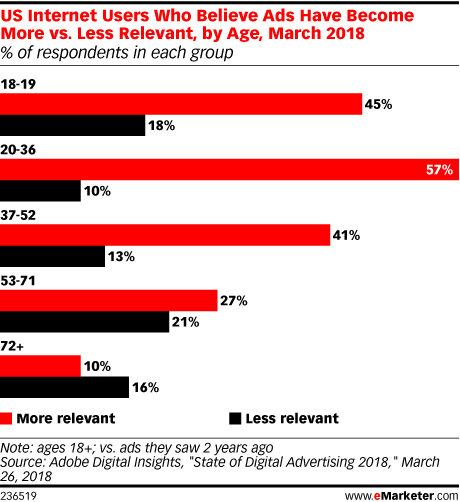
Read MorePerception Of Advertising Relevance By Age [CHART]
Many US internet users, particularly younger ones, believe ads have become more relevant over the past two years, data from Adobe Digital Insights reveals.
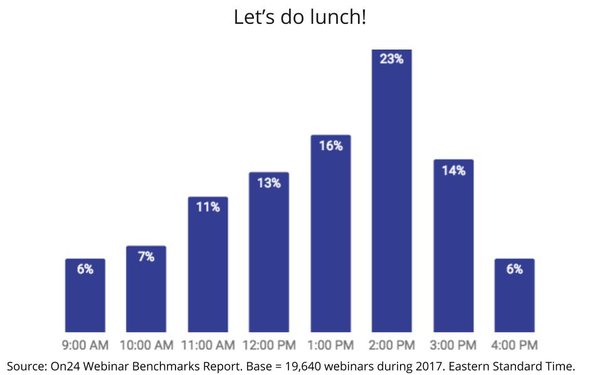
Read MoreBest Dayparts For Webinar Attendance [CHART]
While midweek is the best time to host a webinar, the midday hours during or just after lunch — noon to 3 pm (EST) — are the sweet spot during the business day, accounting for 66% of all webinar attendance.
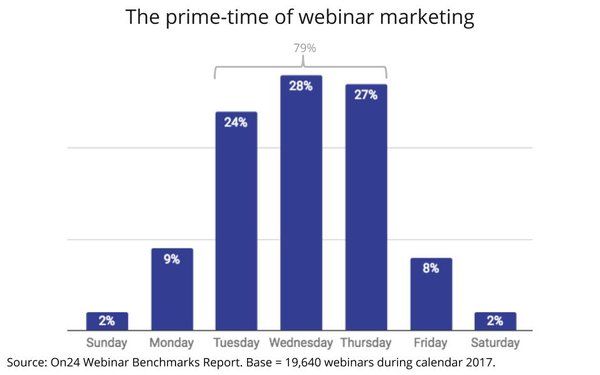
Read MorePrime Time For Webinar Marketing [CHART]
Given the B2B audience nature of the medium, the sweet spot of webinar marketing from a media planning point-of-view is midday and midweek, according to findings of an exhaustive analysis of webinar marketing events held in 2017.
Read MoreCustomer Loyalty [INFOGRAPHIC]
This infographic by FieldBoom illustrateds twenty aspects of customer loyalty and why it is important to your business.
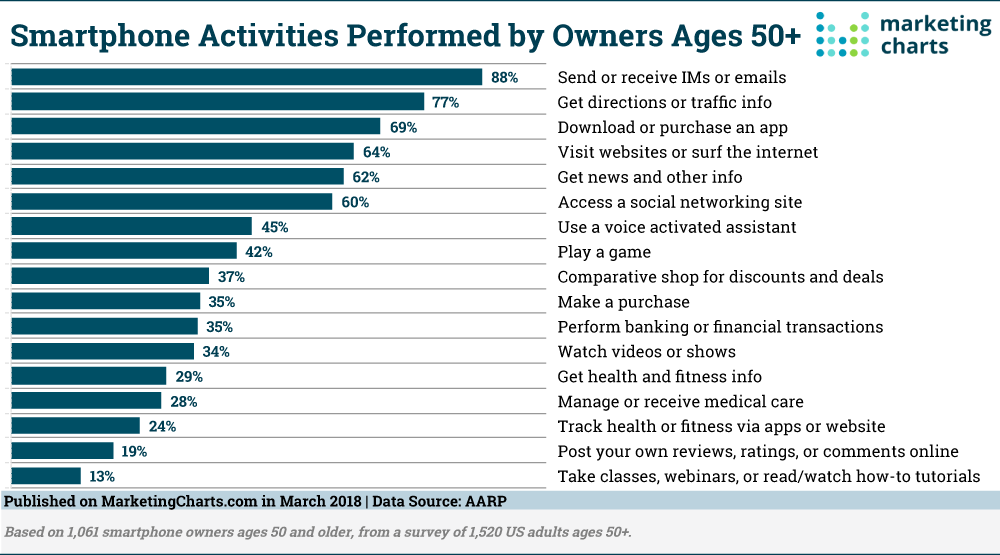
Read MoreSmartphone Activities Americans Over 50 [CHART]
Seven in 10 Americans ages 50 and older own a smartphone, says the AARP in research, and those Americans are most likely to use their devices for messaging.
Read MoreMedia Engagement Activities [CHART]
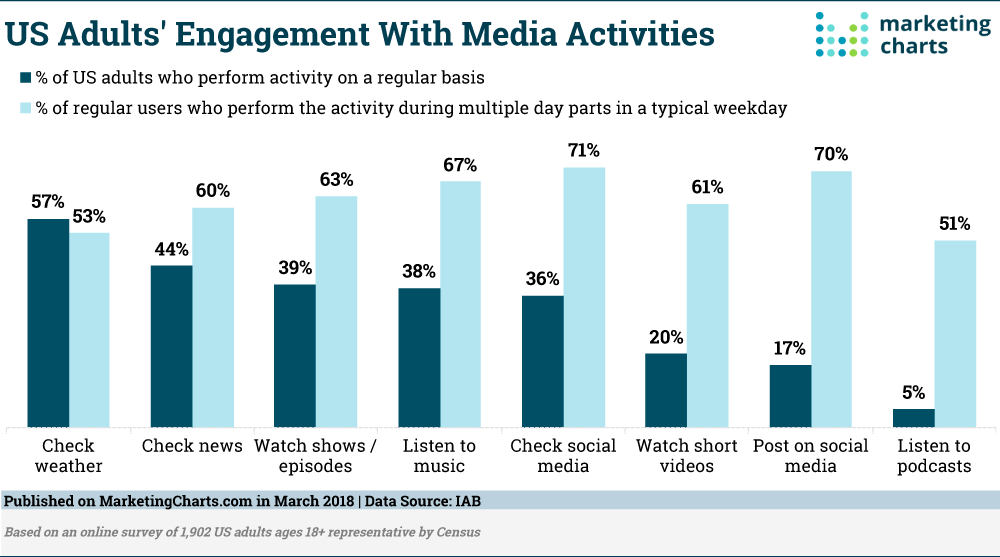
The majority of adults in the US engage with a variety of media on a regular basis, ranging from watching shows and episodes to listening to music, checking social media and watching short videos.
Read More