Video
Brand Response Times To Social Media Complaints, February 2014 [CHART]
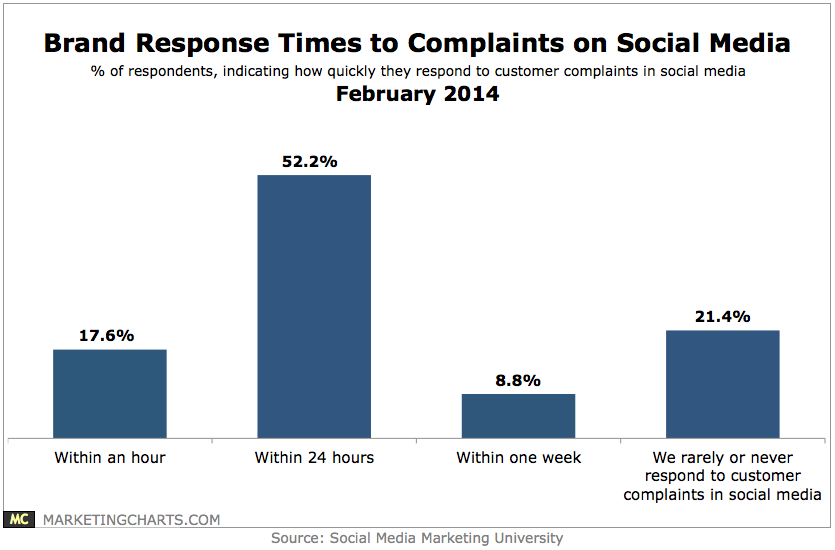
About 6 in 10 brands receive customer complaints via social media occasionally, while close to 1 in 6 receive them Somewhat (10.9%) or Very (4.9%) often.
Read MoreWill Olympics Viewers & Branding, February 2014 [TABLE]
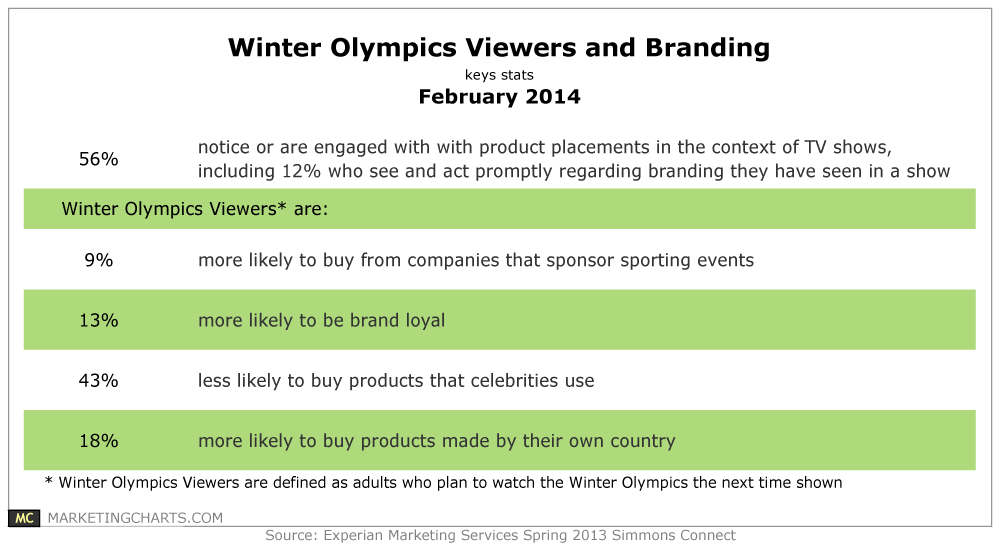
Winter Olympics viewers are quite receptive to branded messaging on TV.
Read MoreHappy eCommerce Customers [INFOGRAPHIC]
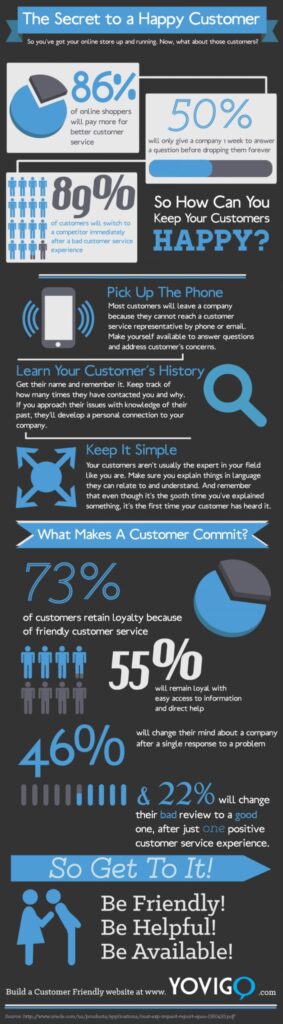
This infographic by Yovigo illustrates what makes eCommerce customers happy.
Read MoreConsumers' Interest In Sharing Brand Information, February 2014 [CHART]
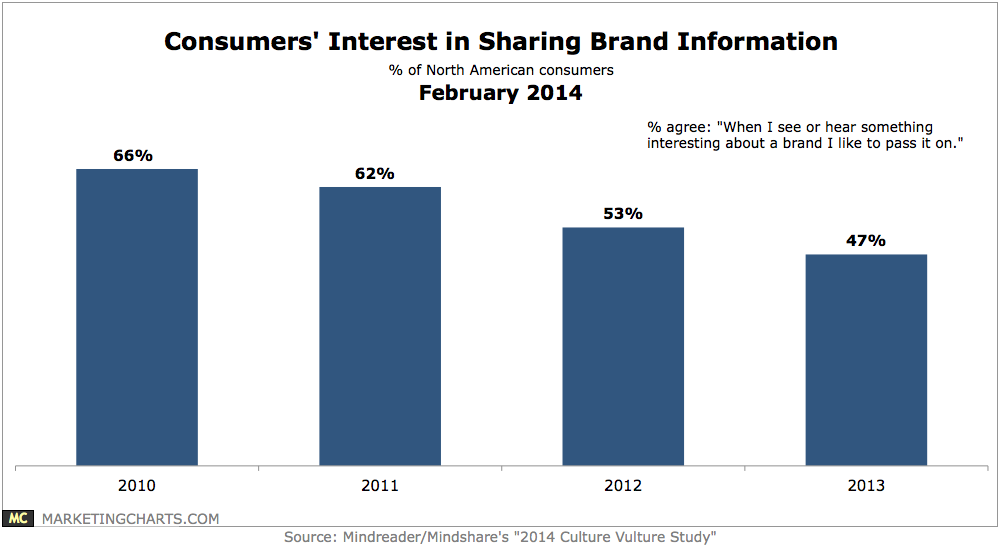
Only 47% of North American consumers last year agreed that they like to pass on interesting things they see or hear about brands, with that figure having steadily fallen over the past few years, from 66% in 2010.
Read MoreMonthly Time Spent On Social Networks, July 2013 [TABLE]
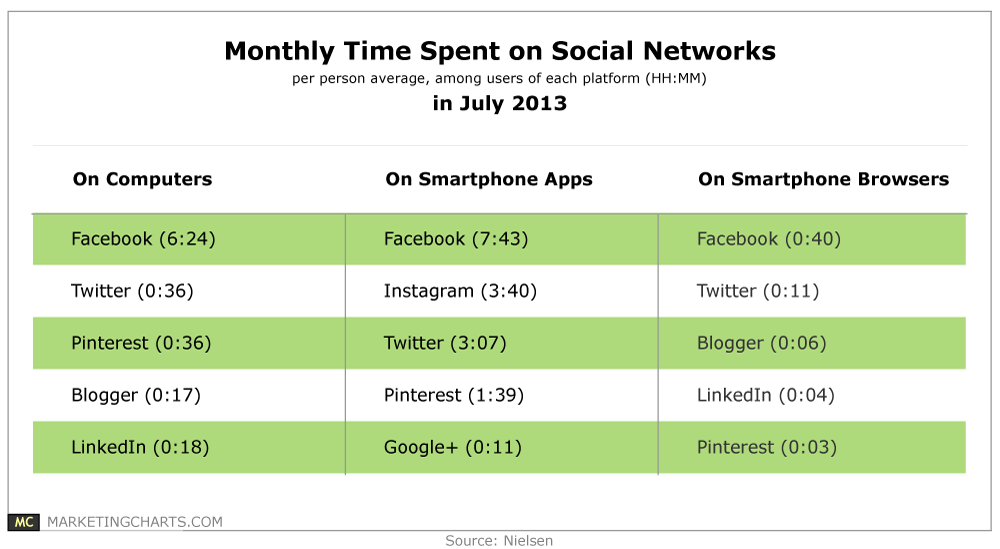
Among smartphone app users in July 2013, Instagram users were spending more time per person per month on the platform (3 hours and 40 minutes) than Twitter users (3 hours and 7 minutes).
Read MoreSMBs Use Of Social Media, February 2014 [TABLE]
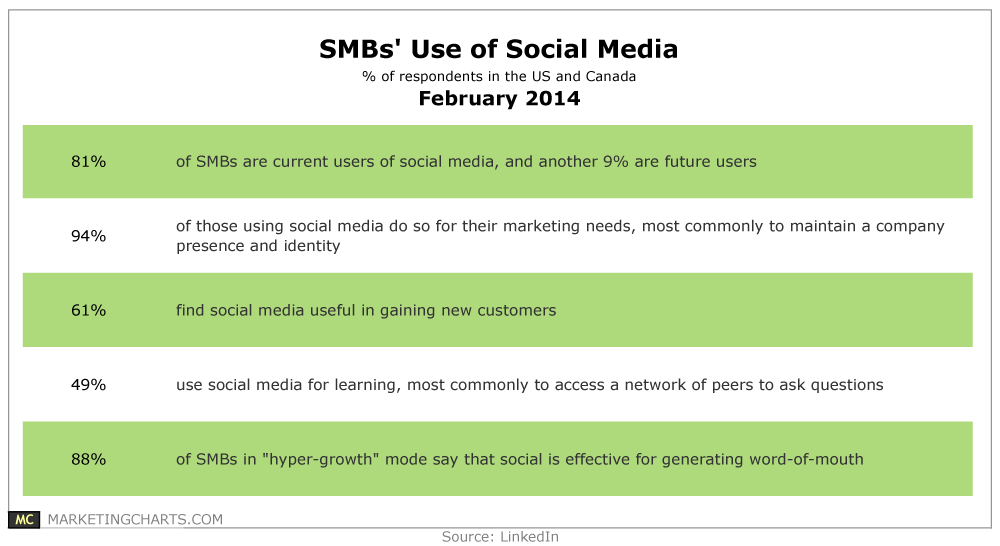
8 in 10 SMBs currently use social for their business, with the vast majority – 94% – of those doing so for their marketing needs.
Read MoreUSA Today 2014 Super Bowl Ad Ratings [INFOGRAPHIC]
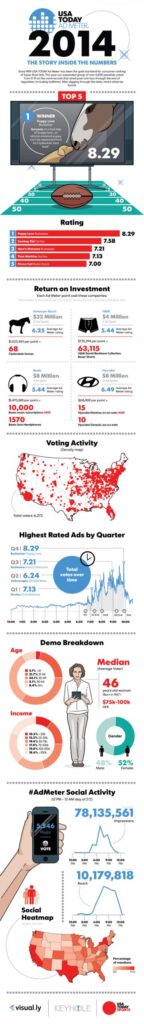
This infographic by USA Today illustrates the top commercials for the 2014 Super Bowl and their return on investment.
Read MoreGlobal Traveler, 2014 [INFOGRAPHIC]
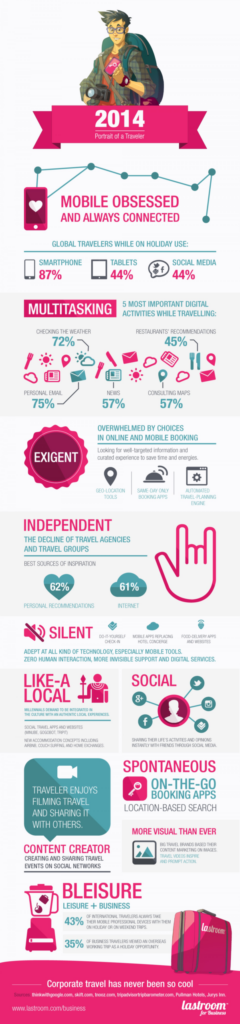
This infographic from LastRoom paints a picture of the behavior of the global traveler of 2014.
Read MoreSocial Media Users In 2013 By Network [INFOGRAPHIC]
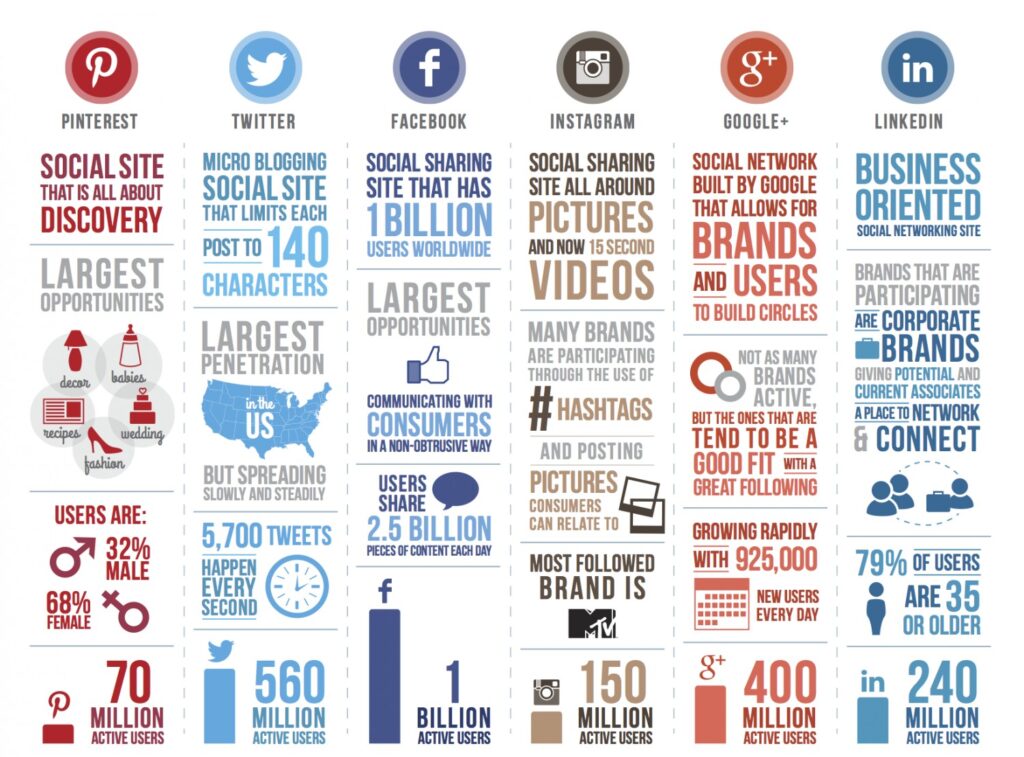
This infographic by Mark Taylor illustrates 2013 statistics for Pinterest, Twitter, Facebook, Instagram, Google+ and LinkedIn.
Read MoreTop Ten Grossing Sci-Fi Movies [INFOGRAPHIC]
This infographic by Outer Places illustrates the top ten grossing science fiction films of all time.
Read More