Video
Affluents Expected Spending Changes, March 2014 [TABLE]
US affluent spending hadn’t completely rebounded: 45.0% of respondents were still being cautious with major purchases, saying they wouldn’t spend on any of the options listed.
Read MoreMajor Purchases Planned By US Affluents, March 2014 [TABLE]
Purchasing or leasing a new car and having a major home remodeling tied as the No. 1 major purchases US affluents planned to make over the next 12 months, each cited by 25.0% of respondents.
Read MoreAir Travelers' Online Behavior [INFOGRAPHIC]

This infographic from Kenshoo illustrates air travelers’ online behaviors.
Read More10 Ways To Use Images On Social Media [INFOGRAPHIC]
This infographic from Fresh Take On Content illustrates 10 ways to use images to engage your social media followers.
Read MorePinterest Users & Brand Marketing, May 2014 [TABLE]
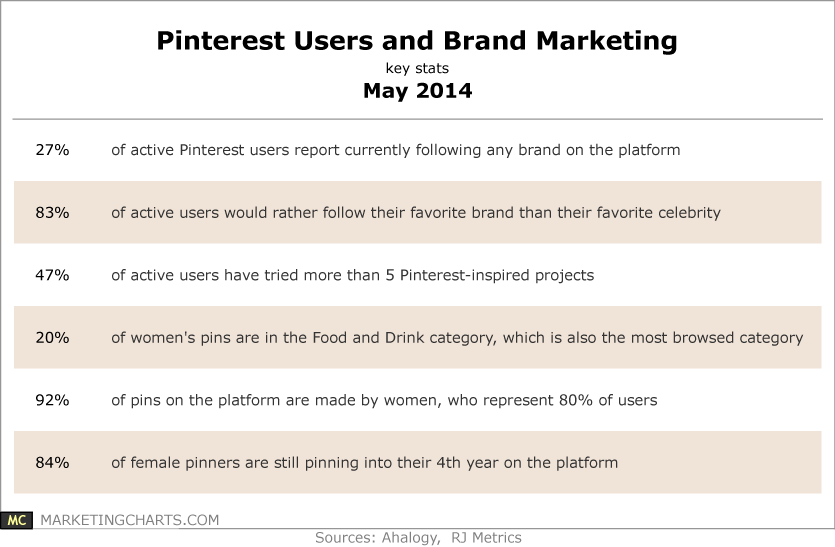
Just 27% of active Pinterest users (who use the platform at least once a month) say they follow any brands on the platform.
Read MoreShare Of Daily TV Consumption, May 2014 [CHART]
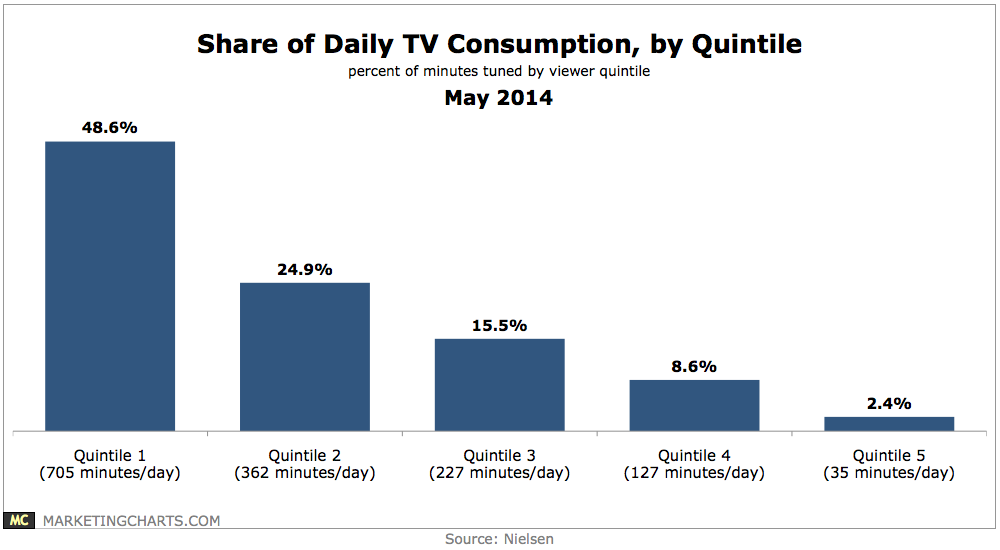
The top quintile of TV viewers (in terms of daily consumption of TV) watch an average of 705 minutes daily, or almost 12 hours of TV per day, with that figure up by almost one hour since 2009.
Read MoreUS Parents Who Follow Brands On Social Networks, January 2014 [CHART]
45% of US mother social networkers with children younger than 18 in the household followed brands on social sites.
Read MoreAmerican Moms' Top Brands, April 2014 [TABLE]
Personal care brands were the best perceived by mothers, with Dove and Johnson & Johnson taking the top two spots, respectively.
Read MoreEngagement & Impact Of Mobile Ads In UK, January 2014 [TABLE]
Because UK mobile internet users spend so much time with apps, it comes as no surprise to learn that in-app ads are the most commonly seen.
Read MoreAverage Number Of Mobile Apps Actively Used By Country, January 2014 [CHART]
The majority of non-voice mobile time is likely being spent with apps rather than the mobile web.
Read More