Video
Evolution Of Video Game Technology
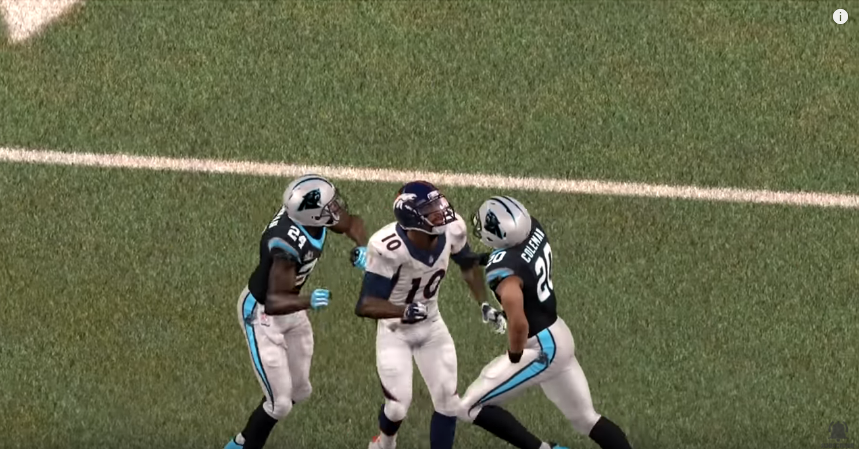
Video games have been the leading edge of the trend toward ever more immersive entertainment. That trend has been driven in large part by the evolution of technology.
Read MoreWhere People Listen To Podcasts [CHART]
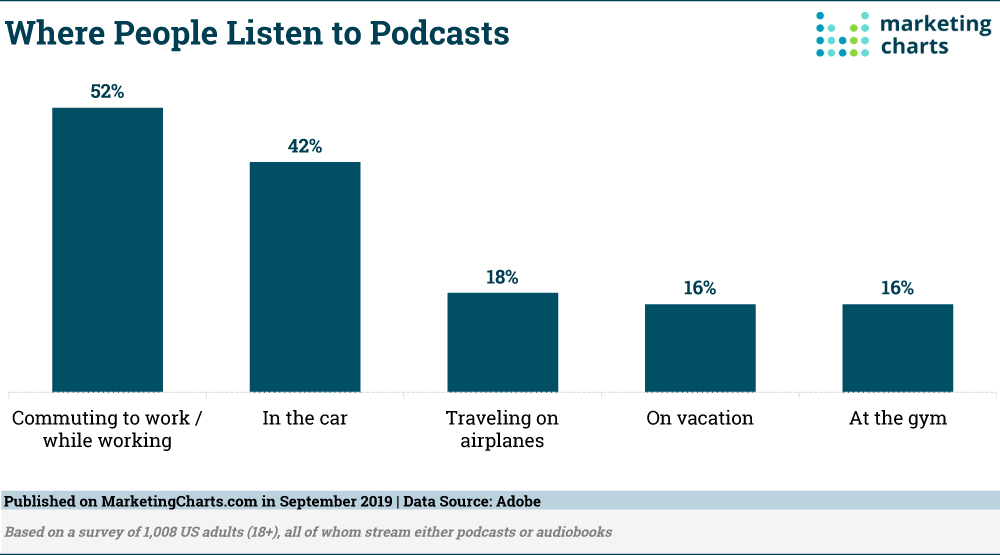
The US population has embraced podcasts, with the majority of Americans over the age of 12 years listening to them on a weekly basis.
Read MoreConstantly Online Demographics [CHART]
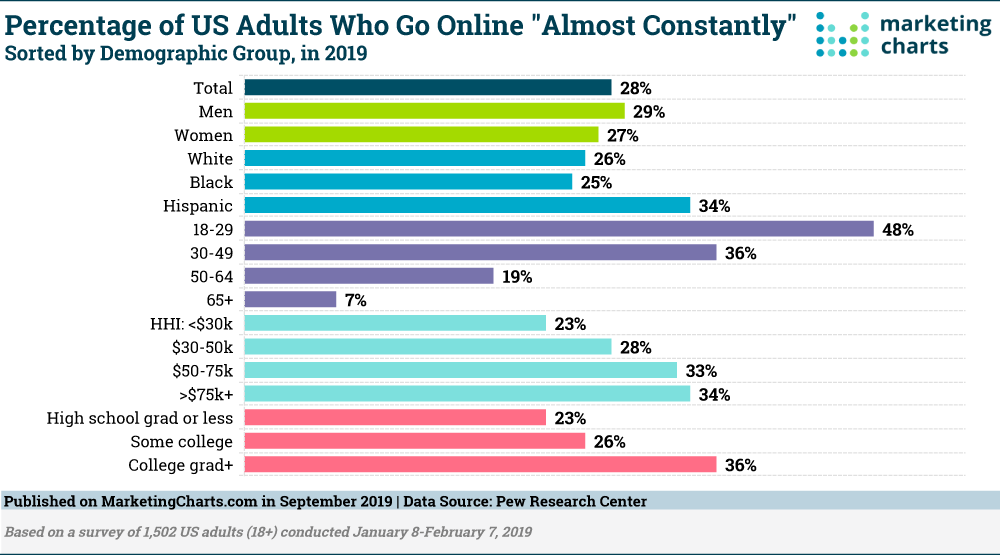
With an increasing number of devices such as smartphones, tablets and smart TVs that all allow individuals to access the internet, it’s no wonder that more adults are going online and with a greater frequency than ever before.
Read MoreSocial Video Ad CTRs By Generation [CHART]
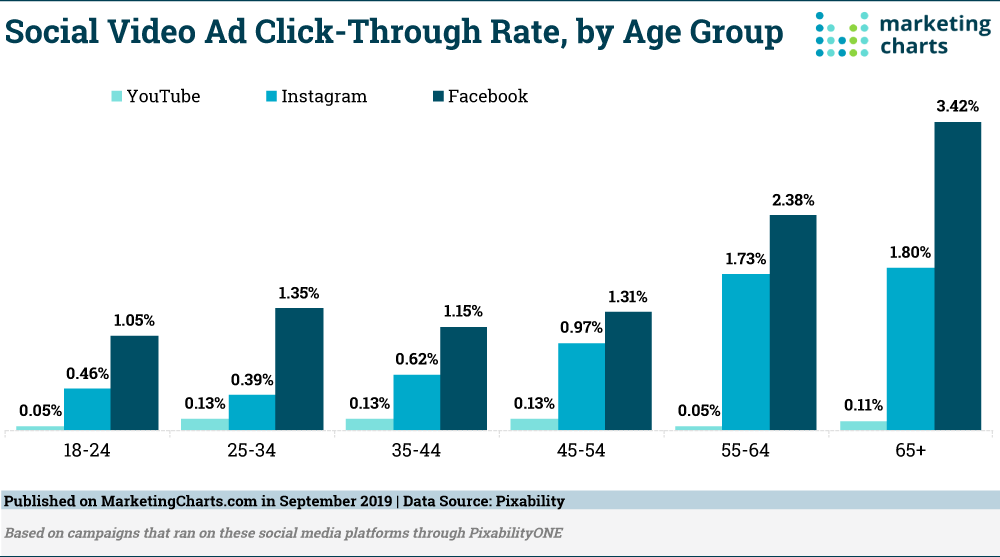
Video accounts for a large portion of the advertising spend of major national advertisers, with marketers contending that video has higher conversion rates than other content.
Read MoreeSports Spending, 2014-2023 [CHART]
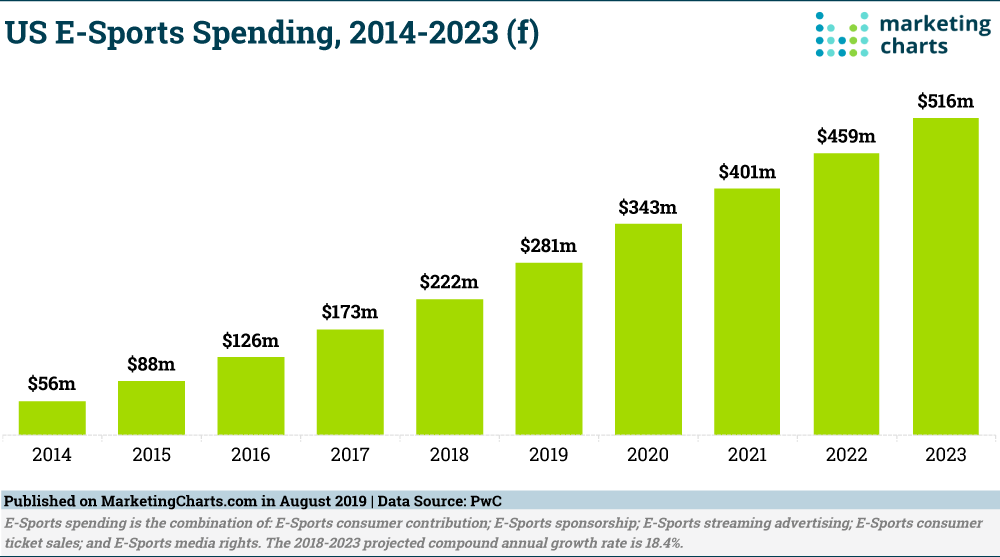
The business of video gaming is big and getting bigger, with a majority of US adults playing this year. A burgeoning area of the gaming industry is much like with regular sports: when people aren’t playing them, they like to watch others play.
Read MoreMillennials' Attitides Toward Social Media Political Advertising [CHART]
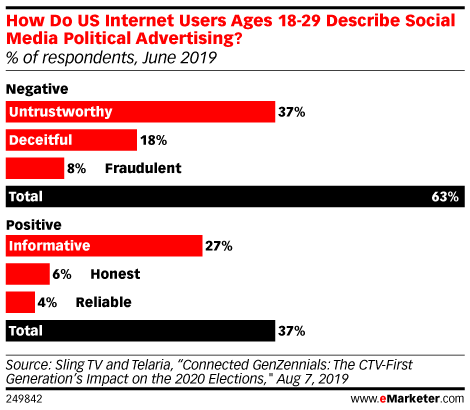
Sixty-three percent of Millennials have a negative attitude toward social media political advertising, according to a survey by Sling TV and Telaria.
Read MoreReasons For Social Media Use, By Generation [TABLE]
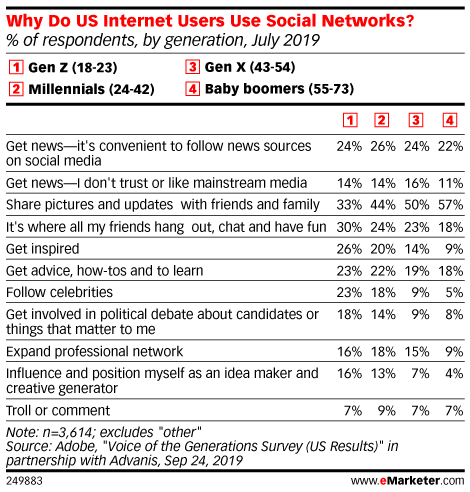
Across US age groups, social media usage is common ground, but that commonality masks many differences in usage.
Read MoreAugmented Reality Dystopia
Watch Hyper-Reality and Merger, two depictions of a dystopian future of augmented reality and algorithms by media artist Keiichi Matsuda.
Read MoreB2B Buying Process Timeline [TABLE]
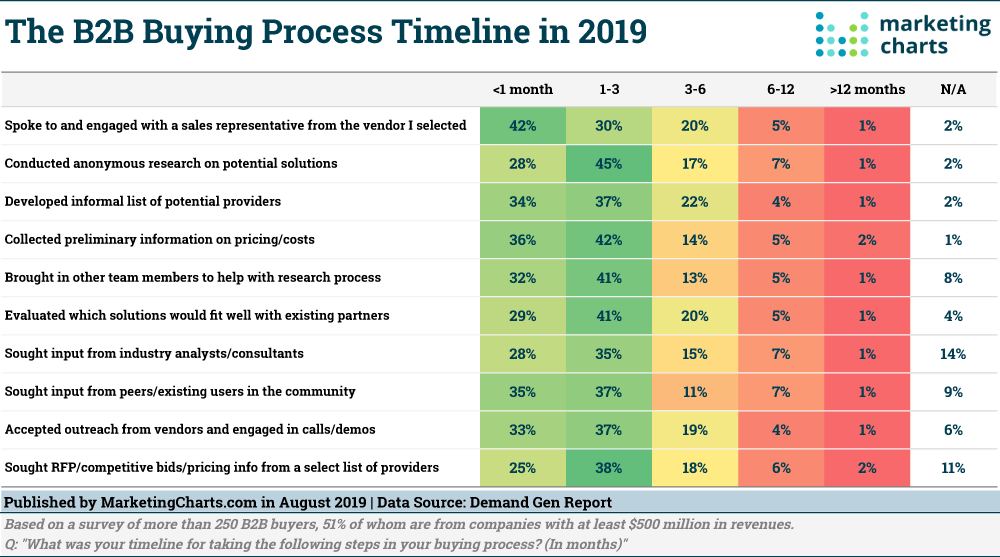
Three-quarters of B2B buyers say they are spending more time over the past year researching purchases, according to Demand Gen Report’s 2019 B2B Buyers Survey Report. While this number is up slightly from last year (72%), other results from the survey also indicate that more buyers are engaging with vendors early on in their buying process.
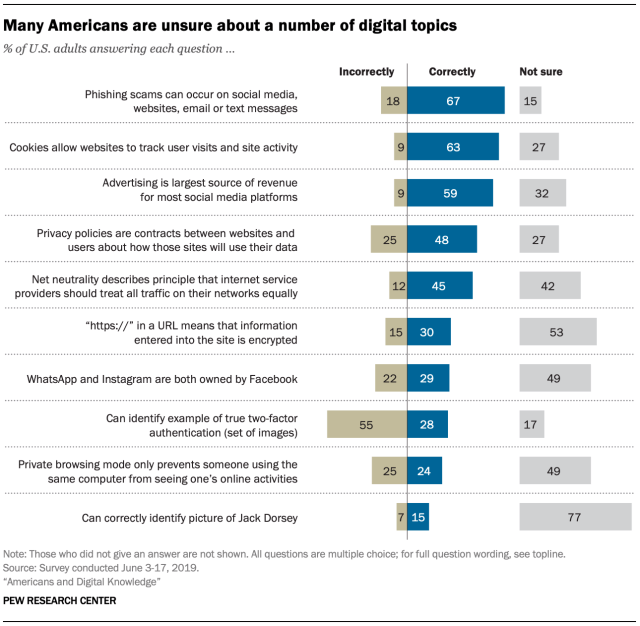
Read MoreDigital Illiteracy [CHART]
A Pew Research Center survey finds that Americans’ understanding of technology-related issues varies greatly depending on the topic, term or concept.
Read More