Video
College Students' Social Media Time By Social Network, May 2015 [TABLE]
May 2015 polling by Fluent among college students ages 17 to 25 found that the vast majority kept their social media activities limited to less than six hours daily.
Read MoreNetflix Original Content Consumption, 2014 vs 2015 [CHART]
Between February 2014 and August 2015, the share of US Netflix users who didn’t watch any original content dropped by one-third.
Read MoreMarketing Email Click Share By Industry, Q2 2015 [TABLE]
On average, 62% of clicks happened on the desktop—14 percentage points ahead of the desktop share of opens.
Read MoreMarketing Email Open Share By Industry, Q2 2015 [TABLE]
Overall, 48% of all marketing emails sent by Experian clients were opened on the desktop,
Read MoreCommunication Devices Used By LGBT By Generation, May 2015 [TABLE]
Age has a significant effect on how LGBT internet users behave when it comes to communication channels and devices, both digital and traditional.
Read MoreHow People Respond To Positive Online Reviews Of Local Businesses, July 2015 [CHART]
Typically, positive online reviews motivate US internet users to visit the business’ website, rather than the business itself—which was the No. 2 response.
Read MoreOnline Customer Reviews' Effect On Local Businesses, 2010-2015 [CHART]
Positive online customer reviews appear to be having a bigger effect than in the past.
Read MoreCreating Shareable Content [INFOGRAPHIC]
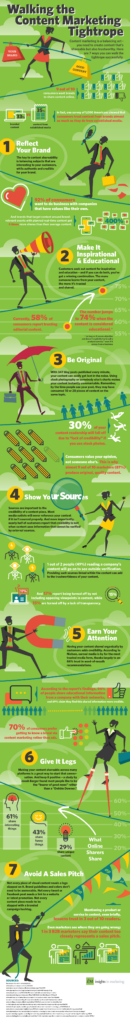
This infographic from Insights In Marketing illustrates 7 steps for creating trustworthy, shareable content.
Read MoreB2B Decision-Makers' Most Influential Information Sources, March 2015 [CHART]
B2B decision-makers are clear on who they trust, and who influences them, when thinking about what to buy for their firms.
Read MoreB2B Decision-Makers' Most-Trusted Sources Of Information For Purchases, March 2015 [CHART]
B2B decision-makers are clear on who they trust, and who influences them, when thinking about what to buy for their firms.
Read More