Consumer Behavior
How Tech Innovation Influences Customer Expectations, January 2015 [CHART]
77% of corporate execs agreed to some extent that the internet and consumer app companies were setting a new benchmark for customer experiences.
Read MoreConsumer Trust In Earned & Owned Media [CHART]
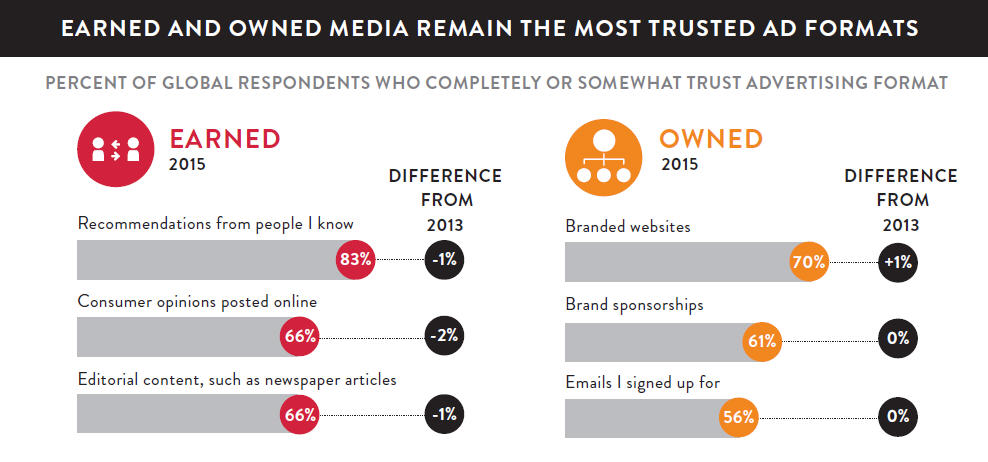
More than eight-in-10 global respondents say they completely or somewhat trust the recommendations of friends and family.
Read MoreMobile Podcast Listeners By Age, September 2015 [CHART]
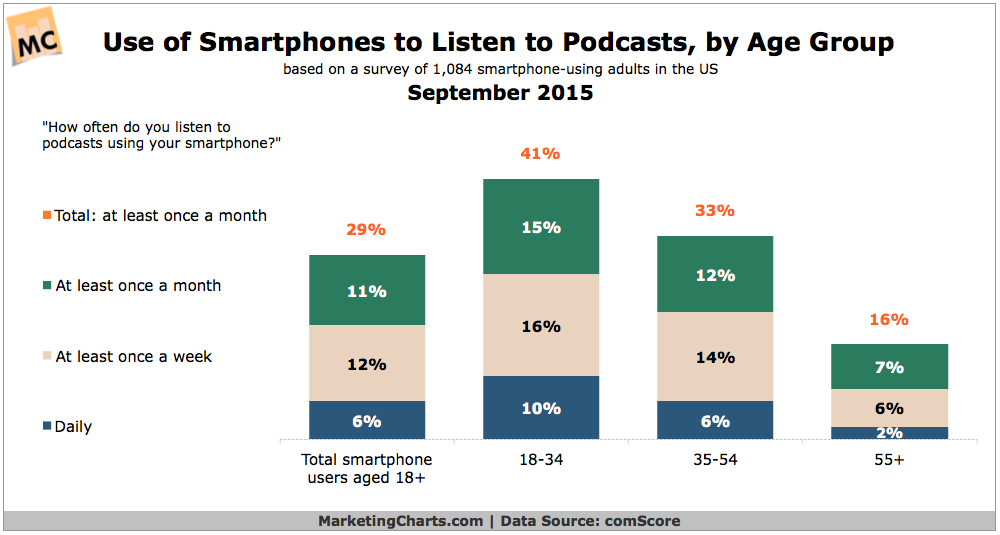
Some 29% of smartphone-owning adults listen to podcasts using their smartphones at least once a month.
Read MoreMobile App User Churn, September 2015 [CHART]
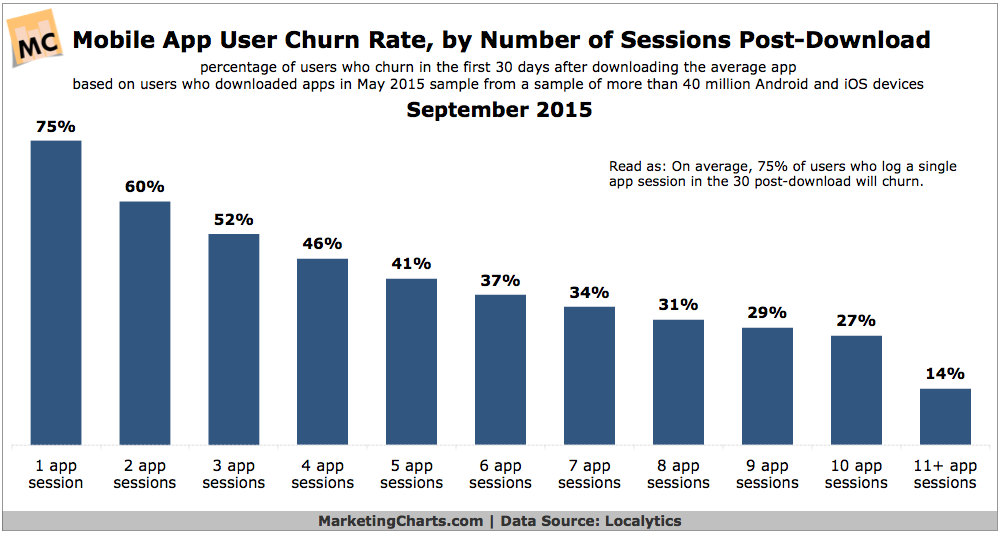
Some 58% of mobile app users will become inactive within the first 30 days after downloading an app.
Read MoreMobile Website Visits By Last-Touch Channel, 2013-2015 [CHART]
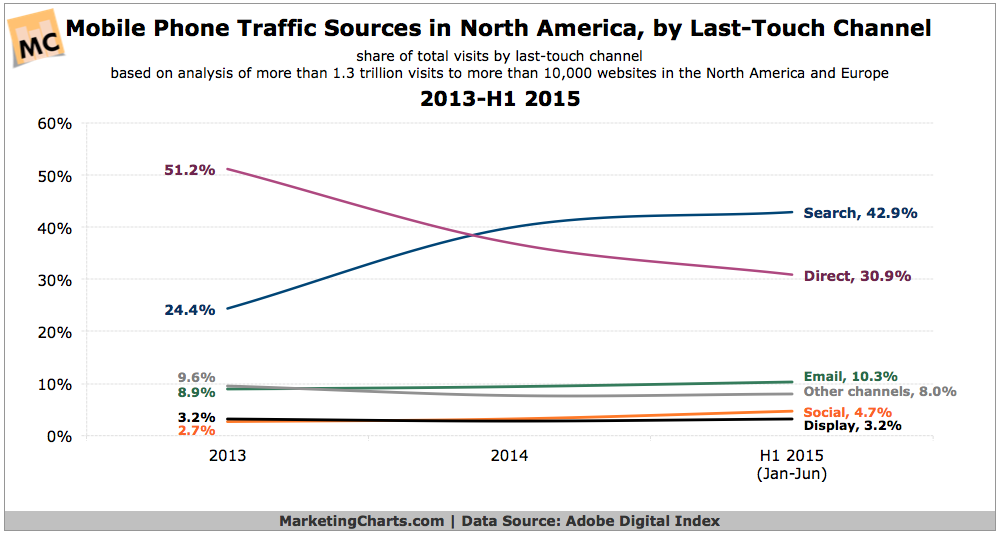
Over the past couple of years, search has overtaken direct as the leading referrer of mobile phone traffic in North America.
Read MoreTrust In Branded Content By Channel, July 2015 [CHART]
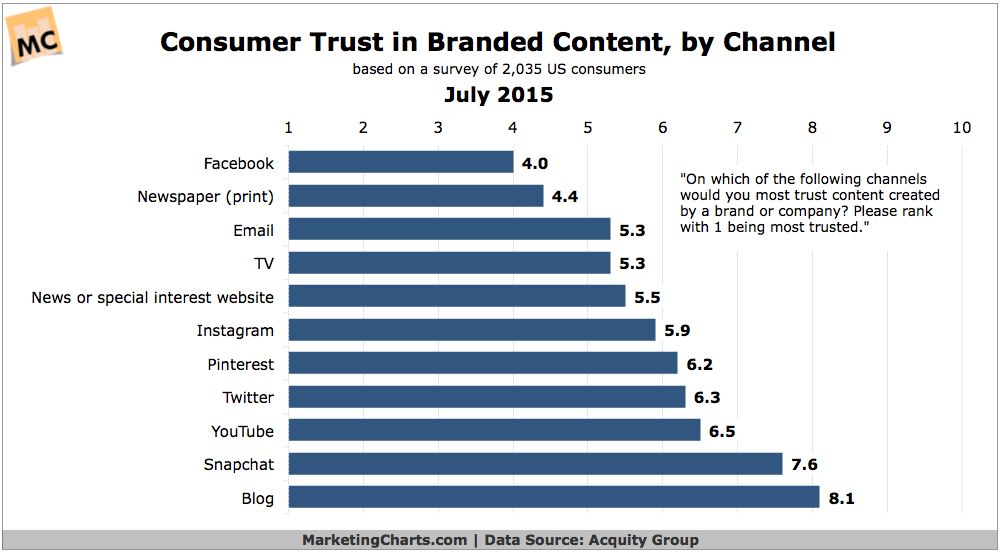
Consumers are more likely to trust brand content found in a print newspaper and on TV than in a variety of social platforms.
Read MoreSmart Phone Activities By Generation, July 2015 [CHART]
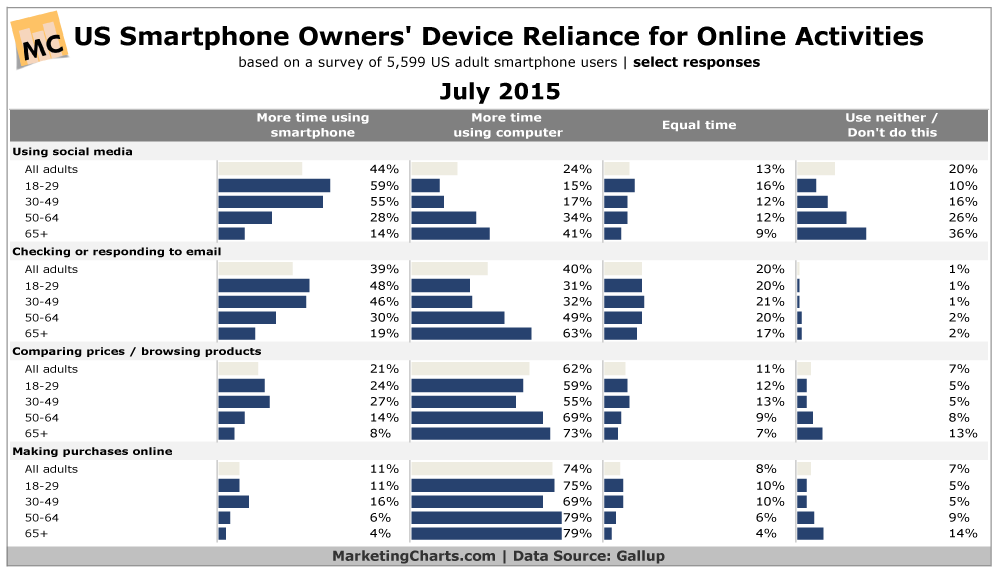
The only activity of those identified for which smartphones are the primary device is social media use.
Read MoreMothers' YouTube Video Preferences, Q1 2015 [CHART]
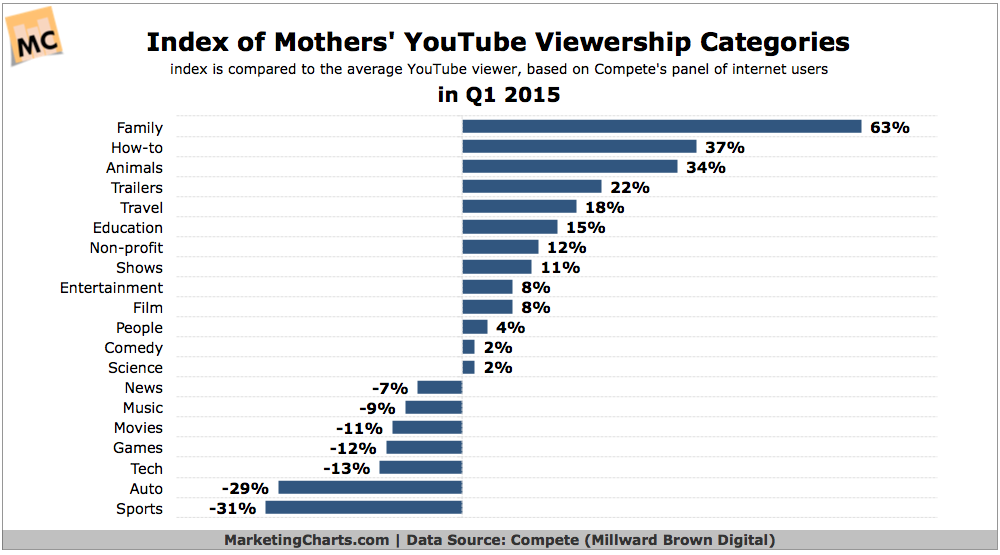
Mothers are avid viewers of YouTube videos, being slightly more likely than the overall internet browsing population to visit YouTube on a monthly basis.
Read MoreNumber Of B2B Deals Closed In 2014 Due To Social Media Use [CHART]
74% of B2B sales professionals in North America who exceeded their 2014 quotas said they were ‘highly effective’ social media users or ‘better than most.’
Read MoreLast Touch Channel Share Of Mobile Visits, 2013-2015 [TABLE]
Once again, search has grown a small amount, up to 44.5% of total referral traffic in 2015.
Read More