Consumer Behavior
Information Sources For Making B2B Software Purchase Decisions [CHART]
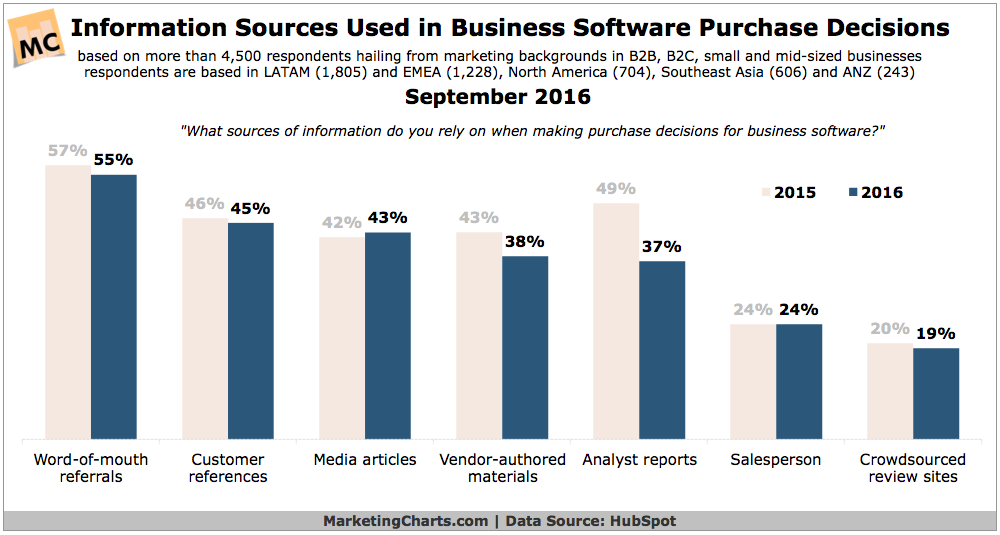
Word-of-mouth is a key purchase influencer for consumers, and it appears to also have a strong sway over purchase decisions for business software.
Read MoreInstagram Stories vs Snapchat Stories [CHART]
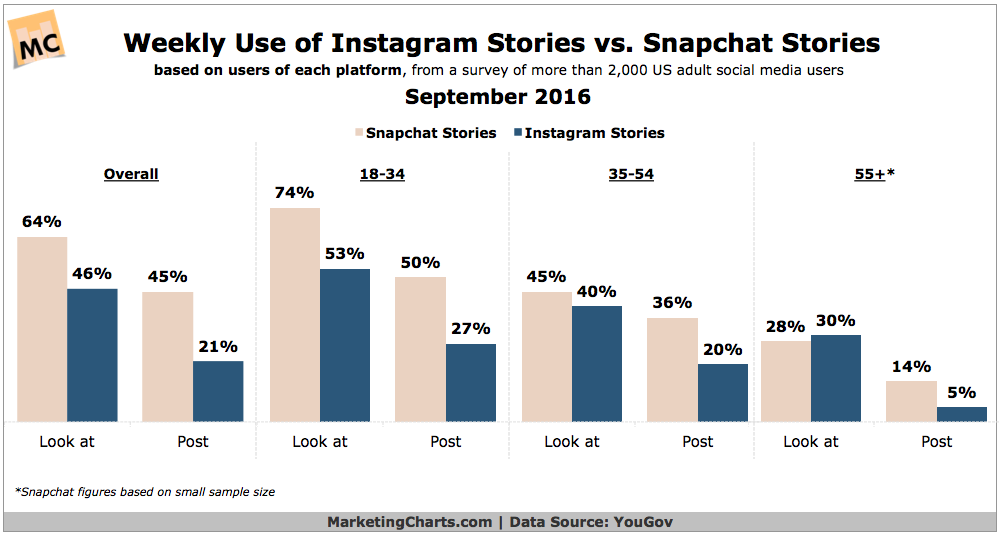
Snapchat users are more engaged with Snapchat Stories than Instagram users are with recently-launched Instagram Stories, and US adults who have used either would rather use Snapchat stories.
Read MoreDemographics Of US Book Readers [CHART]
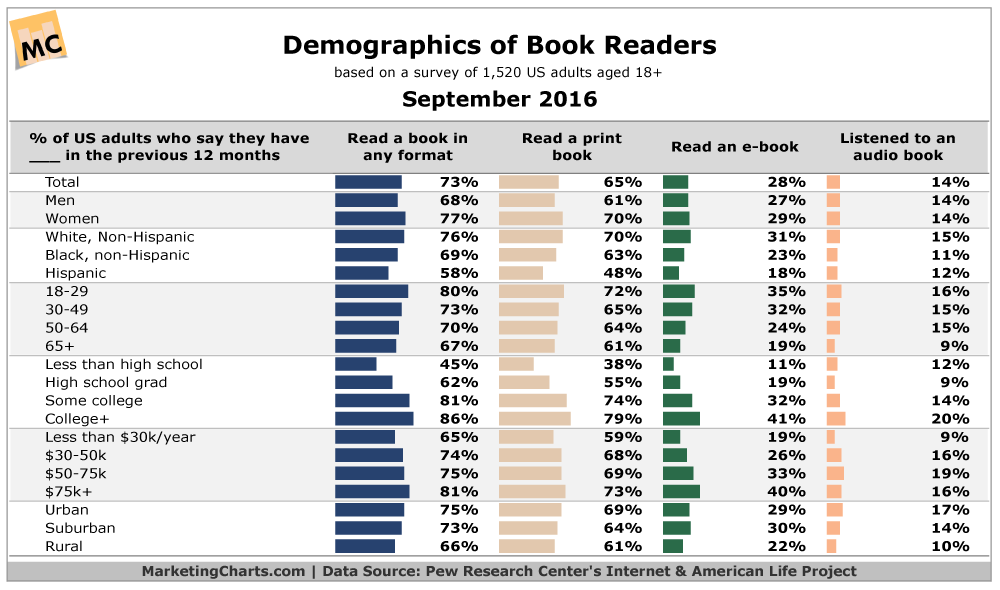
The percentage of American adults who read books has remained relatively unchanged in the past few years.
Read MoreGlobal Expectations Of Trump Regime [CHART]
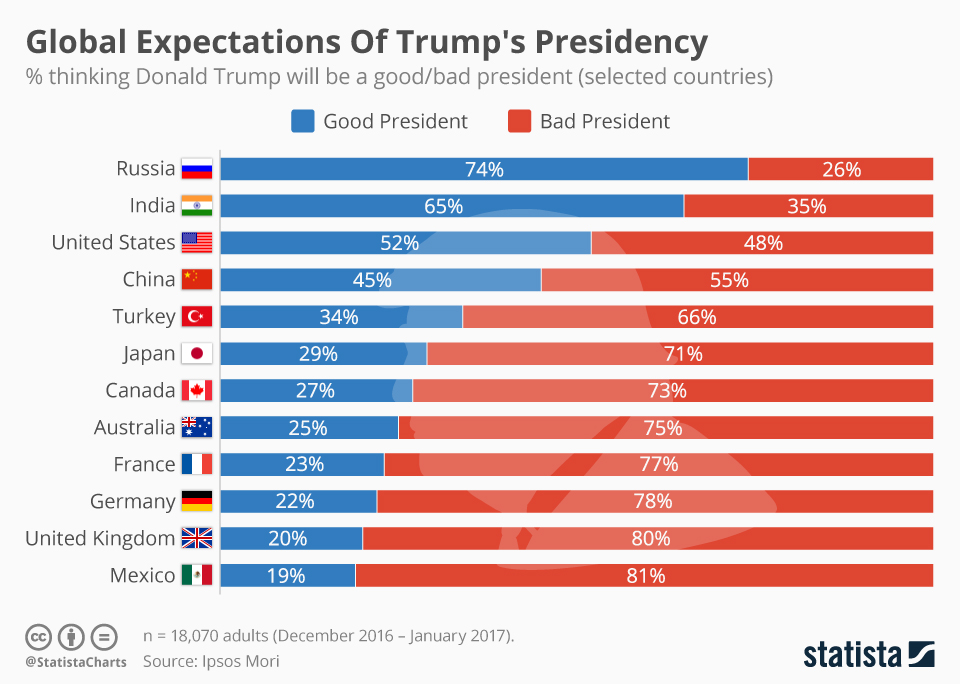
The majority of countries worldwide have low expectations of Donald Trump’s impending stint in the White House.
Read MoreYoung Millennials Online Video Viewing By Channel [CHART]
Teens aren’t the only ones turning to YouTube to consume video content, young adults ages 18 to 20 are as well.
Read MoreMobile Email Marketing Benchmarks [CHART]
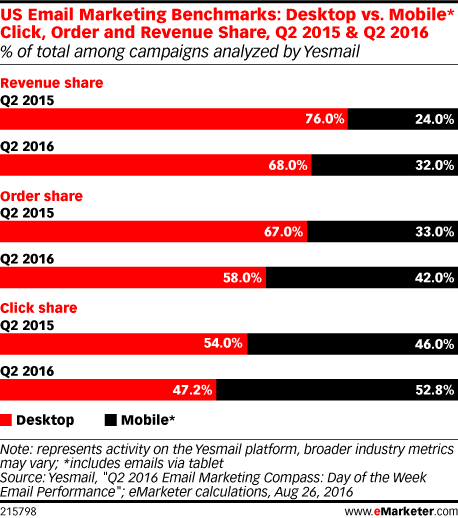
Compared to a year earlier, mobile’s role was more prominent across several metrics.
Read MoreTeen Internet Use By Platform [CHART]
The National Cyber Security Alliance and Microsoft polled 804 US teen internet users ages 13 to 17 about their digital activities.
Read MoreTime Spent On Mobile Web vs Apps [CHART]
This year, US adults will spend 1 hour and 54 minutes a day using apps on their smartphones, 7 minutes more than last year.
Read MoreSocial Media Influence On TV Viewing Decisions [CHART]
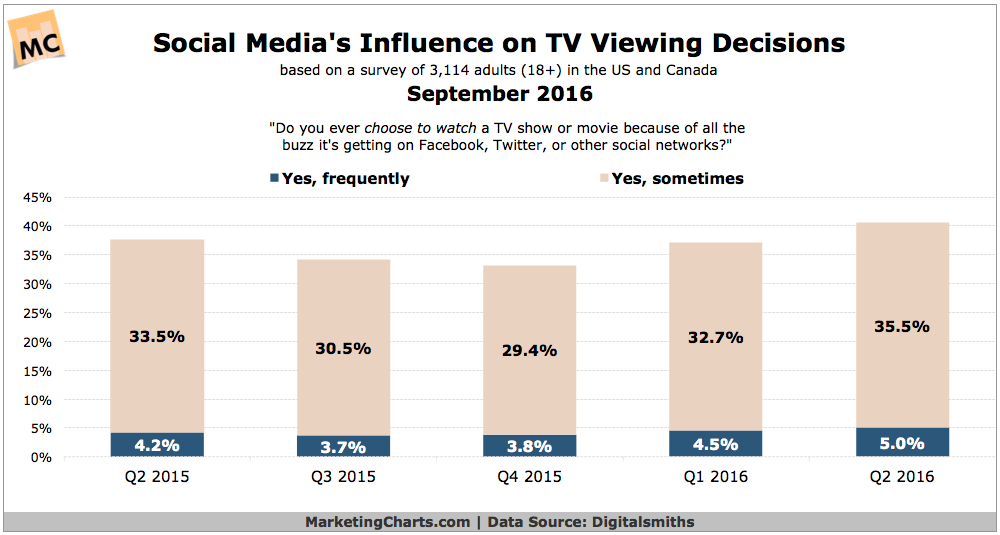
Slightly more than 4 in 10 adults in the US and Canada profess to choosing a TV show or movie at least sometimes because of the buzz it’s getting on social media.
Read MoreEmail Conversion Rates By Day Of The Week [CHART]
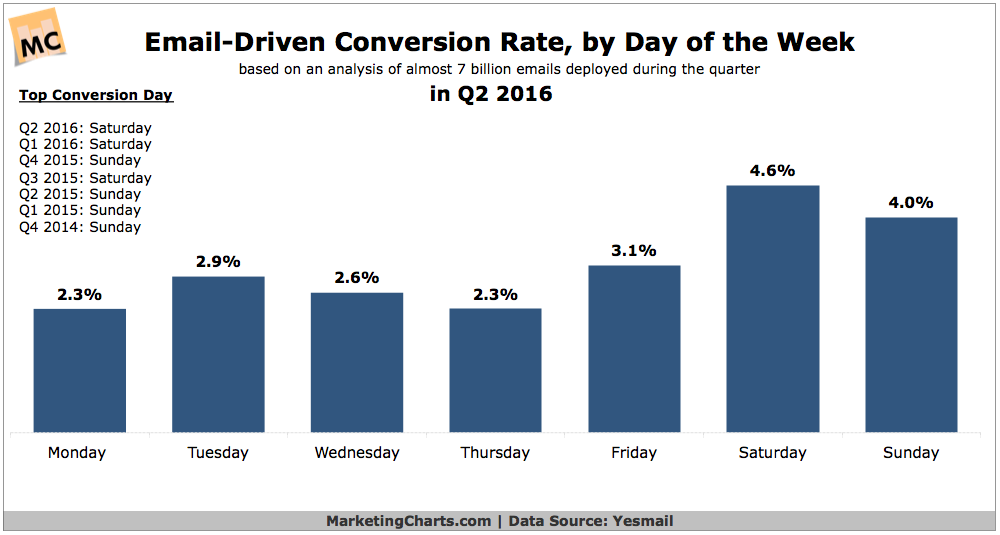
For email marketers, mid-week may provide the best engagement rates, but the weekends are when conversions are highest.
Read More