Consumer Behavior
Top 10 US States By Population Change, July 2011 vs July 2012 [TABLE]
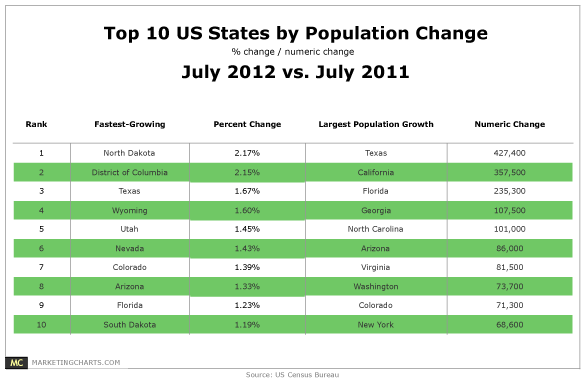
The US population grew by 2.3 million between July 2011 and July 2012 to reach 313.9 million.
Read MoreeMoney [INFOGRAPHIC]
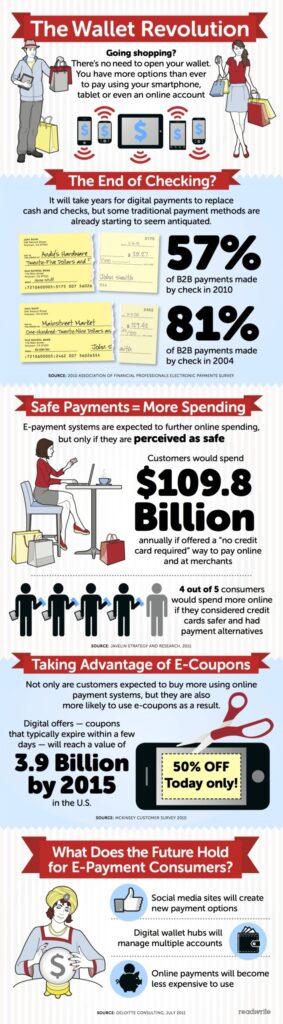
This ReadWrite infographic offers some key data points on the path to digital money.
Read MoreFacebook Privacy Fails [INFOGRAPHIC]
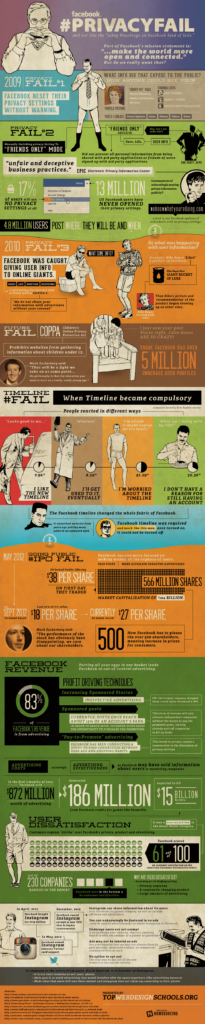
An infographic that lists Facebook’s privacy fumbles.
Read MoreTime Spent Online By Activity & Device, 2012 [CHART]
Social media captures 31% of smartphone internet time, compared to 18% of PC internet time.
Read MoreTime Spent Online By Device, 2011 vs 2012 [CHART]
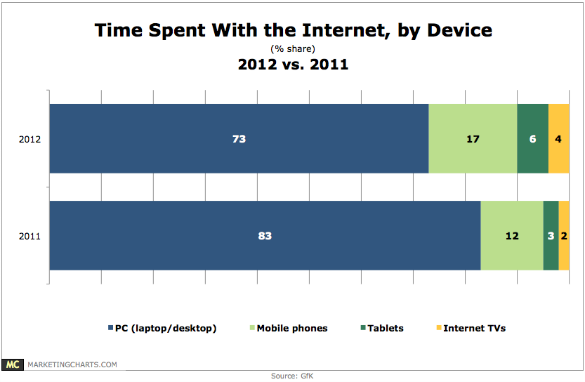
While desktop and laptop computers accounted for 83% of total time spent online last year, that dropped by 10% points to 73% this year.
Read MoreTop 10 YouTube Video Ads Of 2012 [LIST]
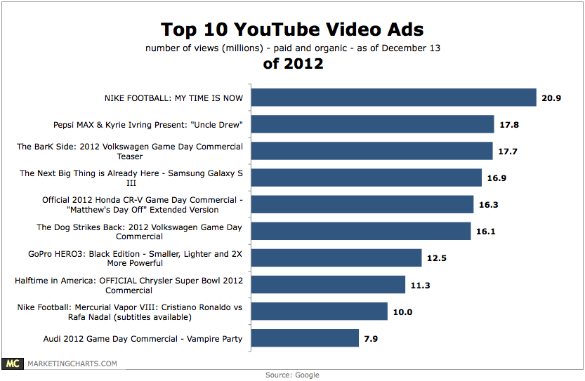
Google’s list of top YouTube ads (in terms of total views) features a mix of sports, automotive, and tech brands.
Read More10 Most Liked Commercials Of 2012 [LIST]
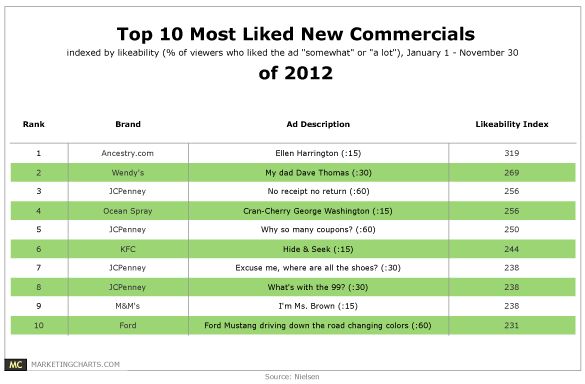
Nielsen has released its lists of most liked new commercials for 2012.
Read MoreMobile Gaming By Time Of Day, December 2012 [CHART]
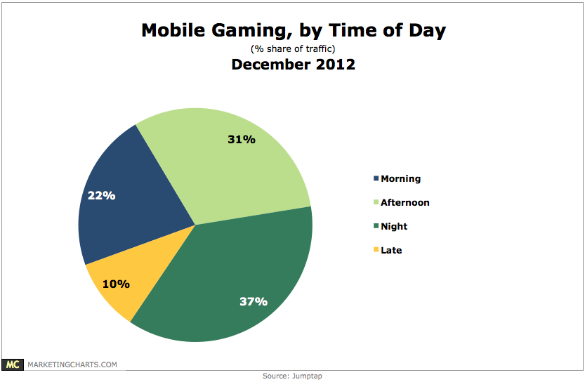
Mobile gamers place a high level of value on the experience gaming provides and they’re most likely to want to have that experience at night time.
Read MoreUS Holiday Season eCommerce By Shopping Period, 2011 & 2012 [CHART]
US holiday retail ecommerce beat many expectations and showed double-digit growth on all of the crucial shopping days in November.
Read MoreUS Travelers' Online Transactions By Device & Travel Category, August 2012 [CHART]

More than half of these US travelers purchased hotel reservations via laptop, while only 17% booked hotels via tablet, and 11% via smartphone.
Read More