Consumer Behavior
US Technology Adoption By Platform, 2010-2016 [CHART]
The overall online penetration rate in the U.S. has stabilized at 79 percent.
Read More92% Of Consumers Share Mobile Video Clips [PIC]
63 percent of digital video screening on mobile phones does not happen on-the-go, but rather at home.
Read MoreMobile Cyber Monday Ad Metrics, 2011 vs 2012 [CHART]
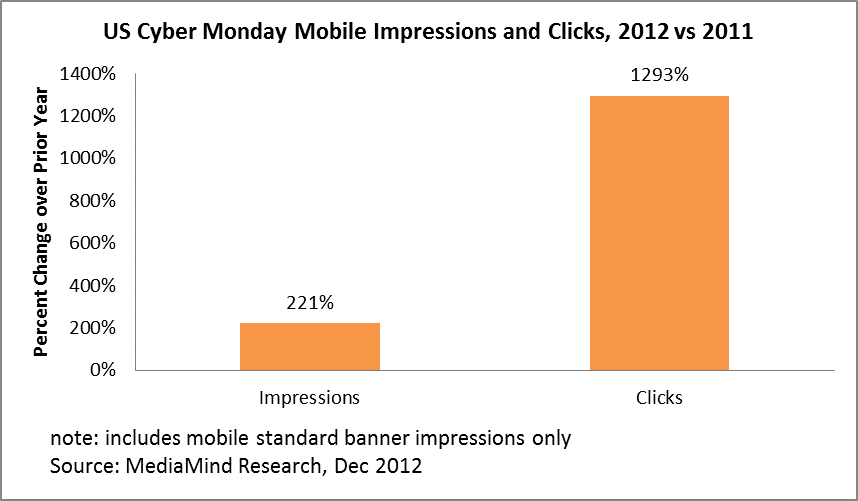
MediaMind’s platform served 46.2% more standard mobile banner, video and rich media impressions on Cyber Monday in 2012 than 2011.
Read MoreMost Socially-Engaging TV Genres, January-November 2012 [CHART]

Sports (31%) and reality (17%) are the primary genres generating social TV buzz, combining to account for about half of social TV conversations.
Read MoreAnticipated Smart TV Market Growth, January 2013 [TABLE]
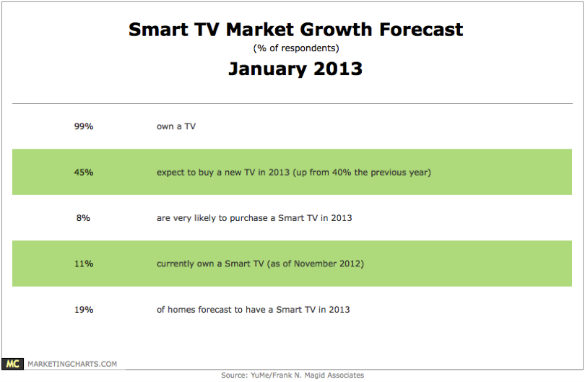
19% of homes will have a Smart TV this year.
Read MoreChristmas Day Smart Device Activations, 2012 [CHART]
17.4 million smart devices (iOS and Android) were activated worldwide on Christmas Day, more than 4 times the baseline average of 4 million from the first 20 days of the month.
Read MoreeBook vs Printed Book Readership, December 2011 vs November 2012 [CHART]
The proportion of Americans aged 16 or older who claim to have read a printed book in the past 12 months has dropped to 67% from 72% a year earlier.
Read MorePurchase Influence Of Online Reviews By Demographics, December 2012 [CHART]
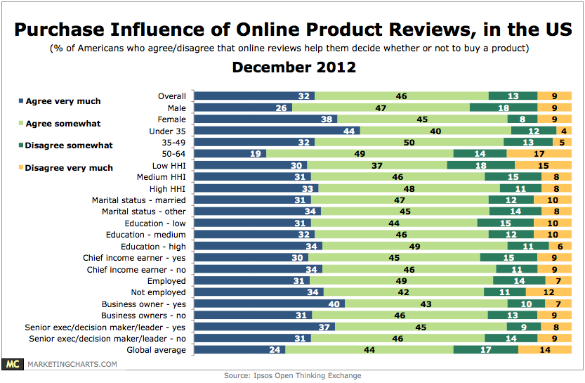
78% of online Americans aged 18-64 agree that online reviews help them decide whether or not to purchase a product.
Read MoreeTailer Holiday Customer Satisfaction Rankings, December 2012 [CHART]
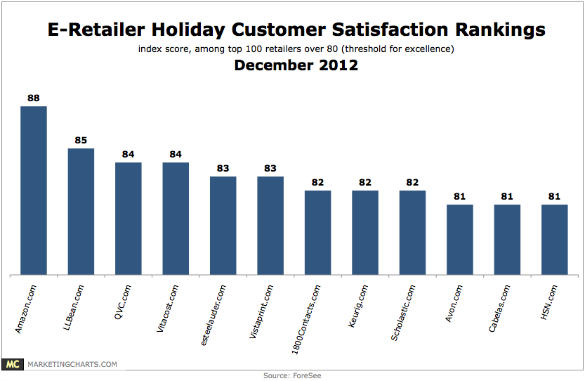
Amazon maintained its leading index score of 88 (on a 100-point scale) from last year, the highest score since the study began in 2005.
Read MoreTrendsetting Latino Shoppers, December 2012 [CHART]
Latinos display markedly different shopping habits than their non-Latino counterparts.
Read More