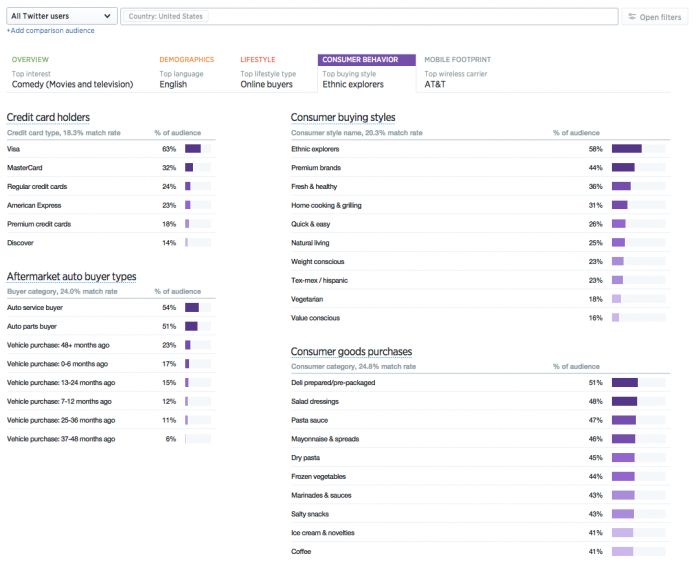
Consumer Behavior
Planned Time Spent At Facebook In 2013, February 2013 [CHART]
38% of Facebook users aged 18-29 say they’ll spend less time on the site over the coming year.
Read MoreTumblr Eyetracking Attention Order [HEATMAP]
This heatmap illustrates the order in which people focus their attention on Tumblr pages.
Read MoreTumblr Eyetracking [HEATMAP]
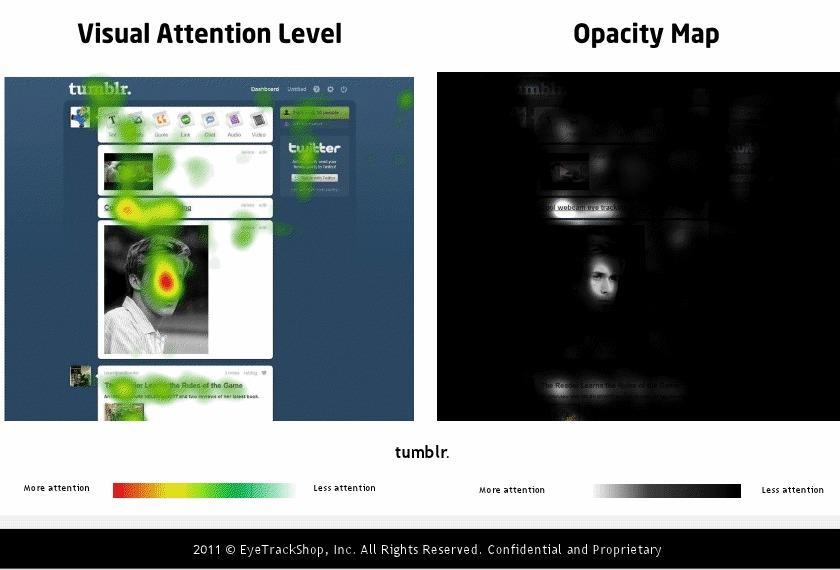
This heatmap illustrates where people focus their attention on Tumblr pages.
Read MoreAmericans Who Post Content To Brand Social Media Sites By Demographic, February 2013 [CHART]
29% of American adults post questions, ideas, and pictures on brands’ social networking sites.
Read MoreDigg Eyetracking Attention Order [HEATMAP]
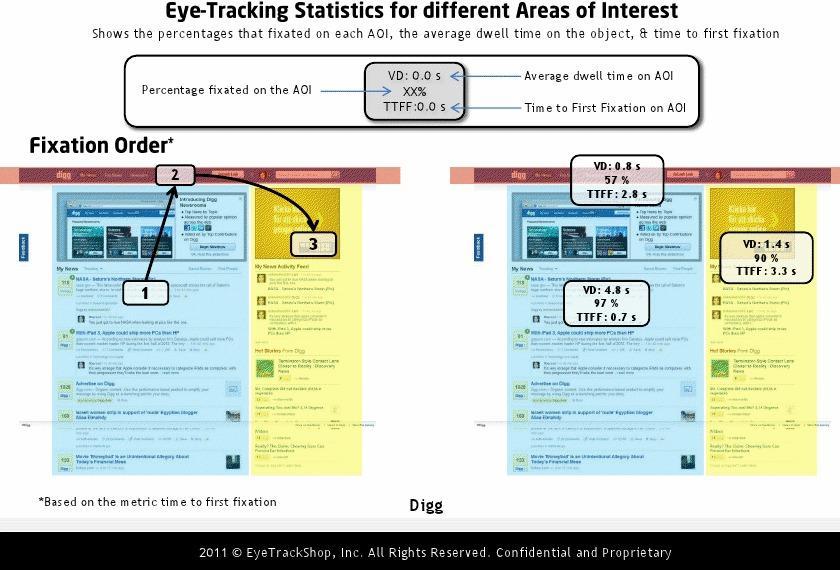
This heatmap illustrates the order in which people focus their attention on Digg pages.
Read MoreDigg Eyetracking [HEATMAP]
This heatmap illustrates where people focus their attention on Digg pages.
Read MoreGlobal Average B2C eCommerce Sales Per Online Buyer by Region & Country, 2011-2016 [TABLE]
Average spending per user is lower in China but the sheer growth in China’s digital buyers is staggering.
Read MoreGlobal Online Buyers By Country, 2011-2016 [CHART]
The US will remain the single country with the largest share of worldwide B2C ecommerce spending, at 29.6% in 2013—down from 31.5% in 2012 despite relatively strong growth.
Read MoreTop 5 Countries In B2C eCommerce Sales, 2011-2013 [CHART]
Sales in North America grew 13.9% to a world-leading $364.66 billion in 2012—a figure expected to increase 12.2% to $409.05 billion this year.
Read MoreGlobal B2C eCommerce Sales By Region, 2011-2016 [CHART]
In 2012, B2C ecommerce sales grew 21.1% to top $1 trillion for the first time.
Read More