Consumer Behavior
College Students' Top Mobile Activities, November 2012 [CHART]
When asked to name their most frequent mobile activity, other than talking or texting, fully 25% of college students cited accessing Facebook.
Read MoreFrequency With Which College Students Find Deals On Mobile Devices, November 2012 [CHART]
Nine out of 10 college students reported using their phones to scour for deals, coupons and specials; just 10% said they never did so.
Read MoreVolume Of Tweets By Political Event [TABLE]
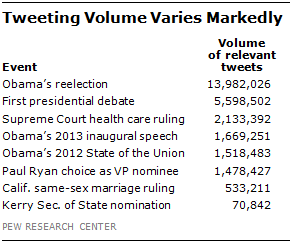
In the two days following Obama’s re-election on Nov. 6, there were nearly 14 million Tweets from people expressing their reaction.
Read MoreTwitter Sentiment During Final Weeks Of 2012 Presidential Campaign [CHART]
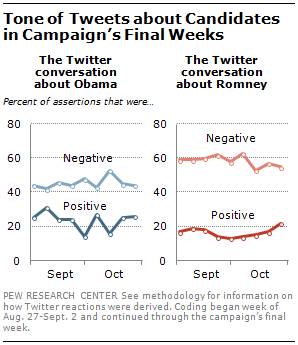
From September through November, Romney was consistently the target of more negative reactions than was Obama.
Read MorePolitical Events For Which Sentiment On Twitter Was Similar To Polls [TABLE]
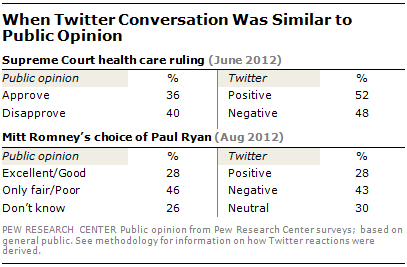
Of the eight events that the Pew Research Center tracked since the beginning of last year, there were two when the reaction on Twitter paralleled public opinion.
Read MoreConservative Sentiment On Twitter Compared To Polls [TABLE]
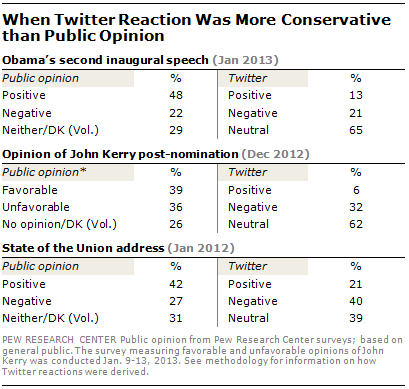
The reaction on Twitter to Obama’s second inaugural address and his 2012 State of the Union was not nearly as positive as public opinion.
Read MoreLiberal Sentiment On Twitter Compared To Polls [TABLE]
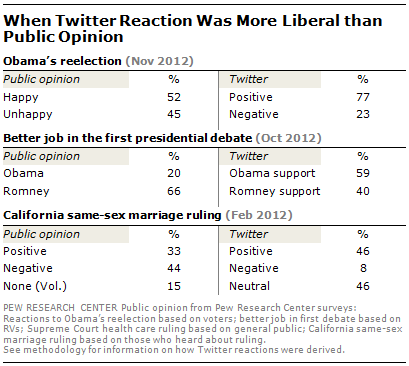
In some instances, the Twitter reaction was more pro-Democratic or liberal than the balance of public opinion.
Read MoreTechnology Adoption Trends, March 2013 [CHART]
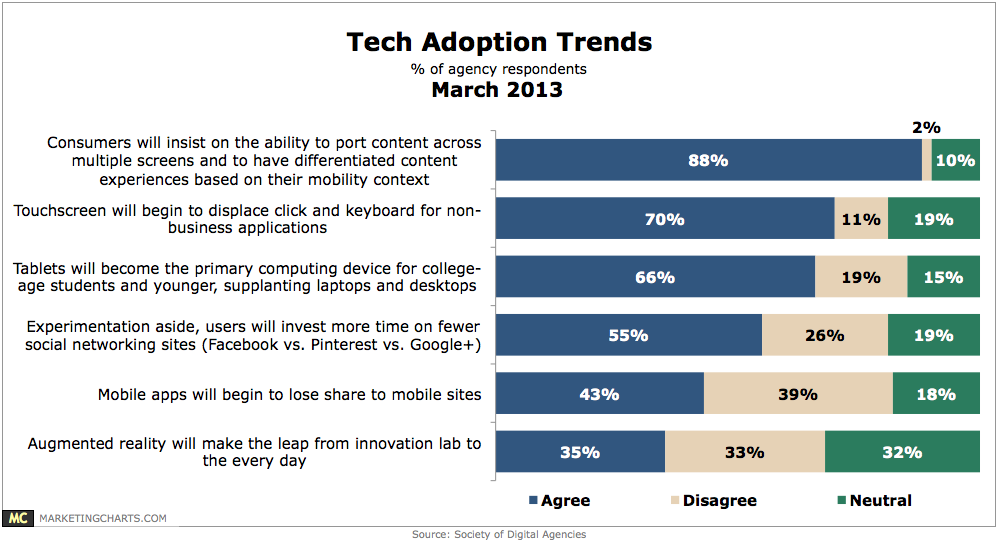
Tablets will become the primary computing device for college-age students and younger, supplanting laptops and desktops, agree 66% of agency leaders.
Read MoreIn-Store Mobile Activities Of African Americans, March 2013 [CHART]
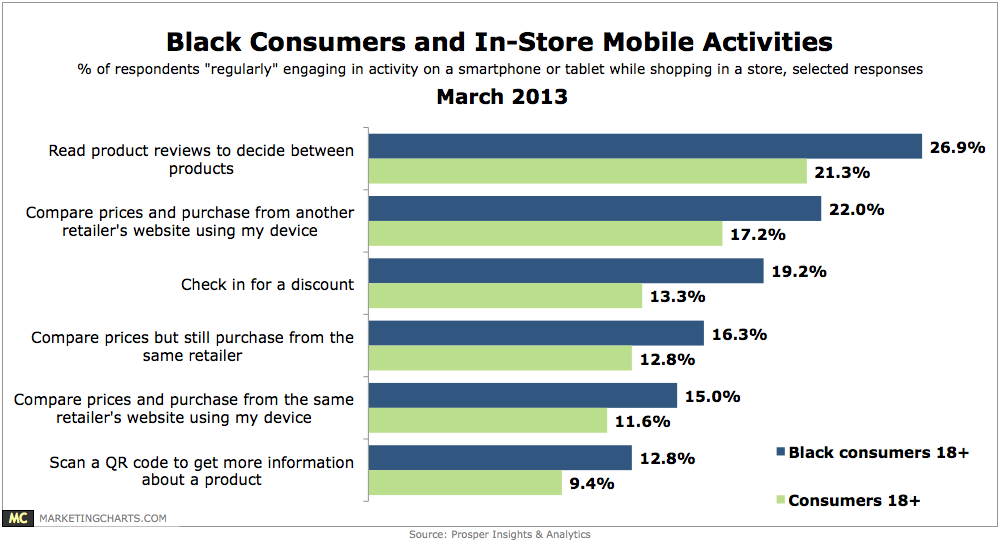
African Americans are 44% more likely to check in for a discount and 37% more likely to scan a QR code to get more information about a product.
Read MoreSmart Phone Market Penetration, October 2011 – January 2013 [CHART]
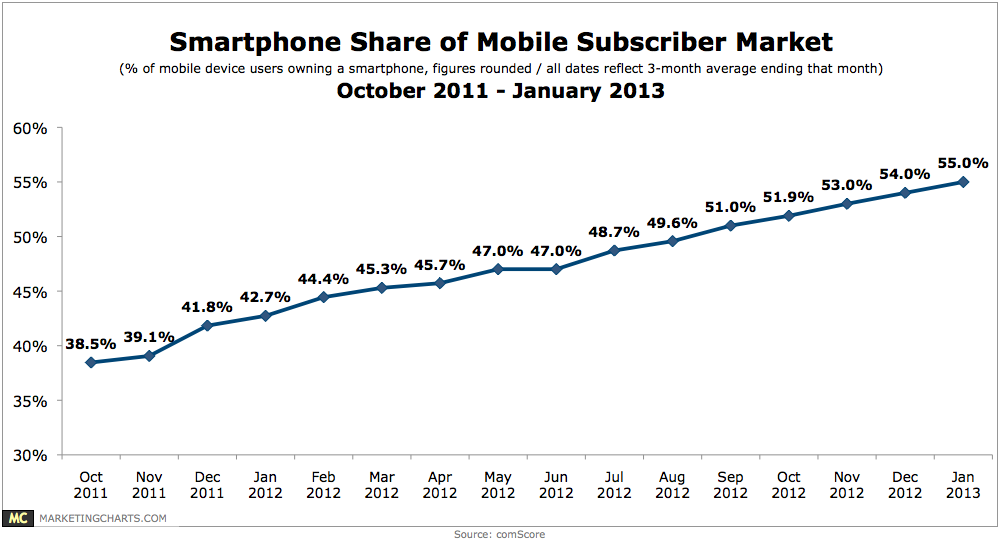
Smart phone penetration reached 55% of the US mobile market during the 3-month period ending in January 2013.
Read More