Consumer Behavior
Zero-TV Homes, March 2013 [TABLE]
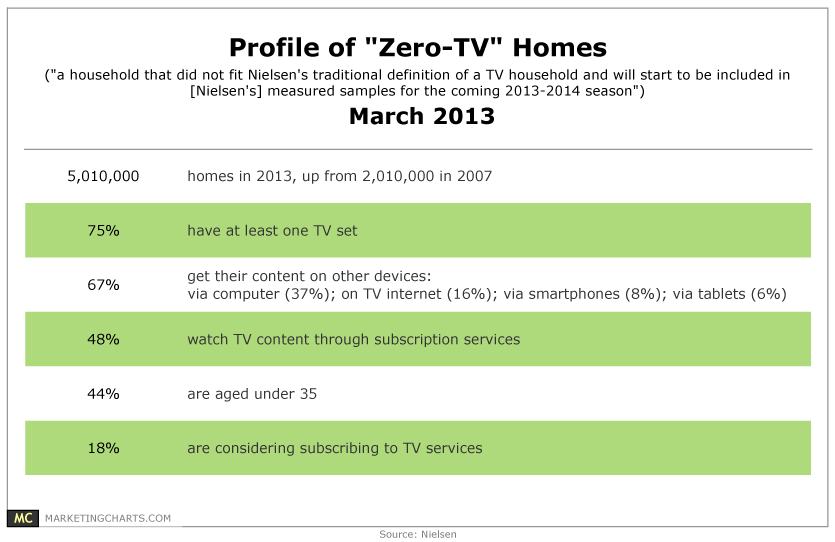
The number of Zero-TV households has more than doubled from 2007 to exceed 5 million.
Read MoreMulti-Screen Behavior, March 2013 [CHART]
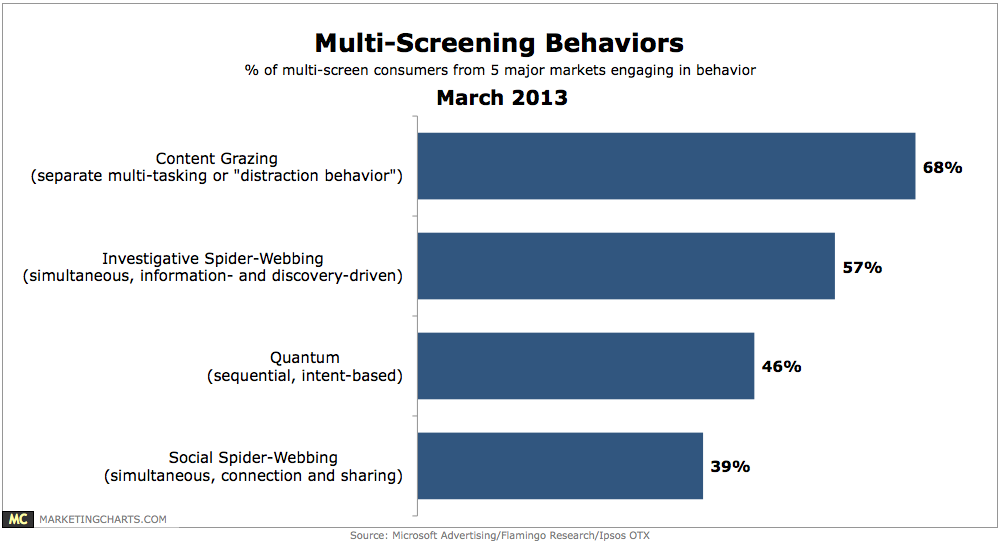
Microsoft Advertising identifies 4 paths of multi-screening behaviors, finding that the most popular type is “content grazing” (68%), in which consumers use 2 or more screens to access separate or unrelated content.
Read MoreEmail Open & Click-Through Rates, Q4 2009-Q4 2012 [CHART]
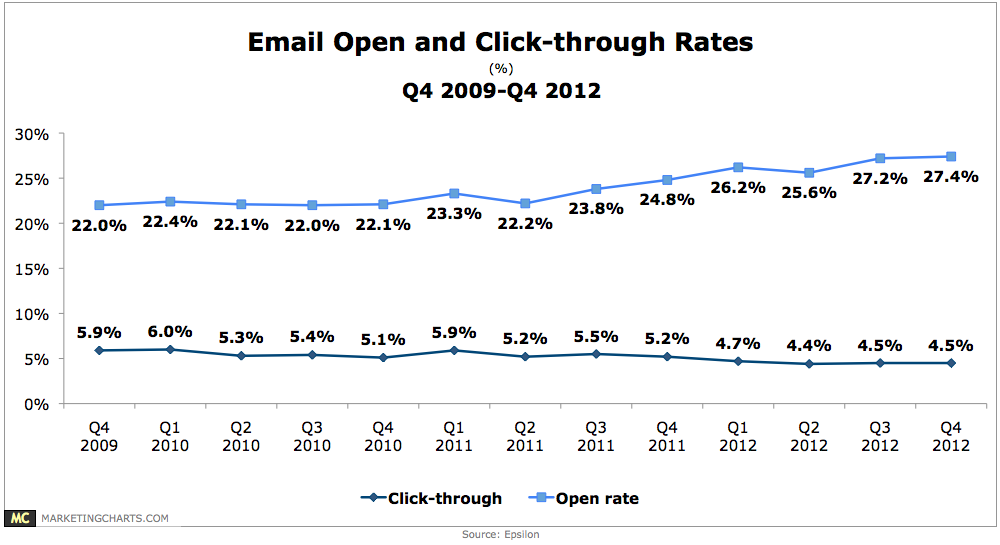
The average email open rate rose to 27.4% in Q4, a slight increase from 27.2% in Q3, and a significant 10.5% gain from Q4 2011′s 24.8%.
Read MoreNews Audience Trends, 2011 vs 2012 [CHART]
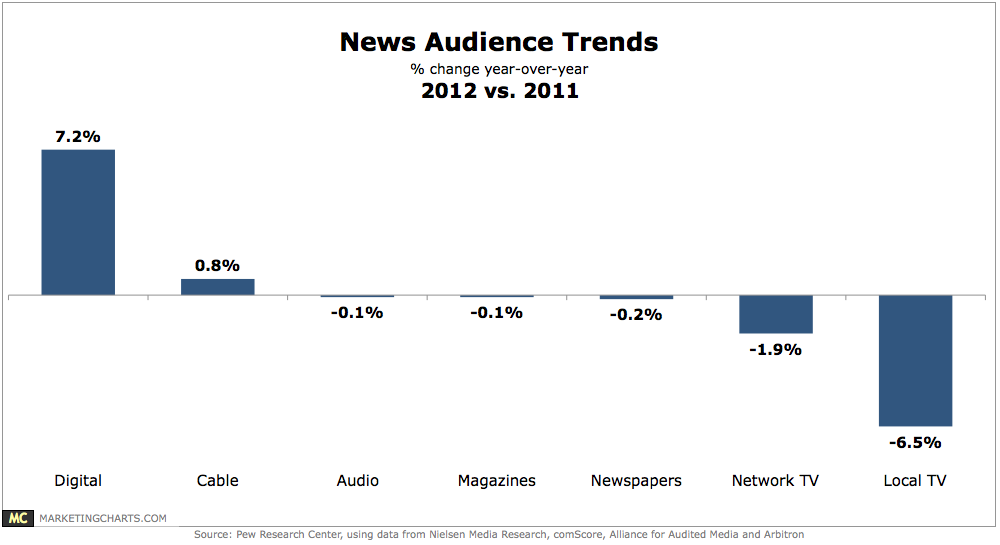
Local TV saw a significant 6.5% drop in audience size between 2011 and 2012, finds Pew Research Center’s Project for Excellence in Journalism in its State of the News Media 2013 study.
Read MoreTop Desired Health Care Website Features, February 2012 [CHART]
53% of health seekers would use a health care site that offered them a tool to tell them how much a health plan would pay for certain treatments or services.
Read MoreAmericans Who Have Postponed Medical Treatment Due To Cost, 2004-2012 [CHART]
Three out of 10 consumers saying they had put off medical treatment due to cost within the last 12 months
Read MoreOnline Health & Wellness Researchers, 2010-2012 [CHART]
87% of US internet users looked online for health and wellness research in 2012.
Read MoreLuxury Shoppers mCommerce Activities, 2011 & 2012 [CHART]
Mobile shopping activity among affluent luxury shoppers in the US saw substantial increases in 2012; the percentage of respondents shopping or purchasing via mobile increased from 22% to 38%.
Read MoreWhere People Mobile Shop, October 2012 [CHART]
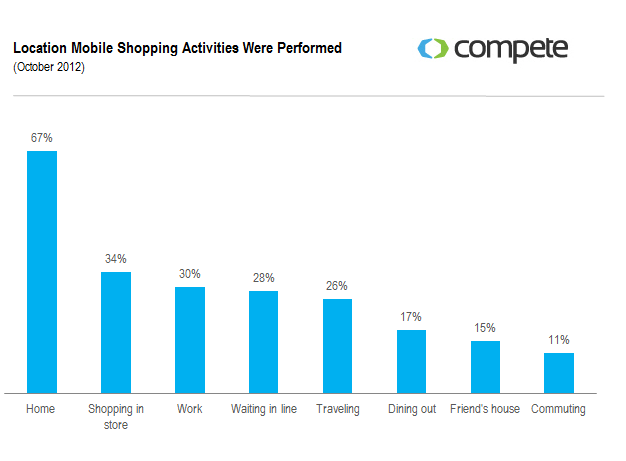
Nearly 1 in 5 consumers performs shopping activities on their phone while dining out.
Read MoreActivities Performed On Computers vs. Tablets vs. Smart Phones [CHART]
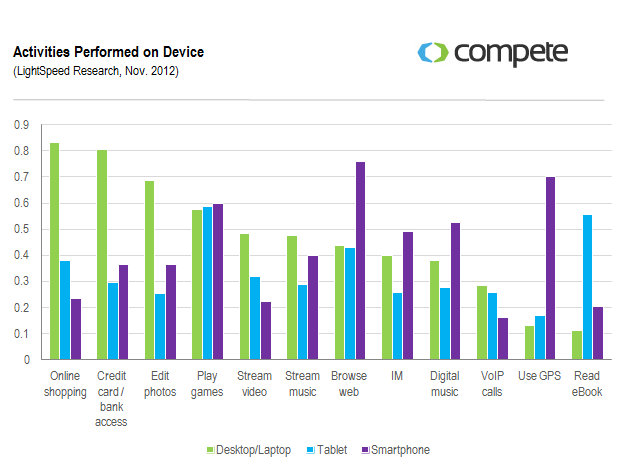
45% of consumers who use their mobile devices to shop report using the device to compare prices.
Read More