Consumer Behavior
Effect Of Gmail Tabs On Email Management By Age, August 2013 [CHART]
The majority of users of Google’s email service had had a neutral or positive response to tabs.
Read MoreWhere Gmail Users Open Their Mail, August 2013 [CHART]
54% of Gmail emails were opened on either an iPhone or Android device, and another 9% opened on the iPad.
Read MoreGlobal Email Open Share By Device, August 2013 [CHART]
47% of worldwide emails in August were opened on a mobile device, up 3% from July and an increase of 24% year over year.
Read MoreAffluent Influencers' Activities By Generation, September 2013 [TABLE]
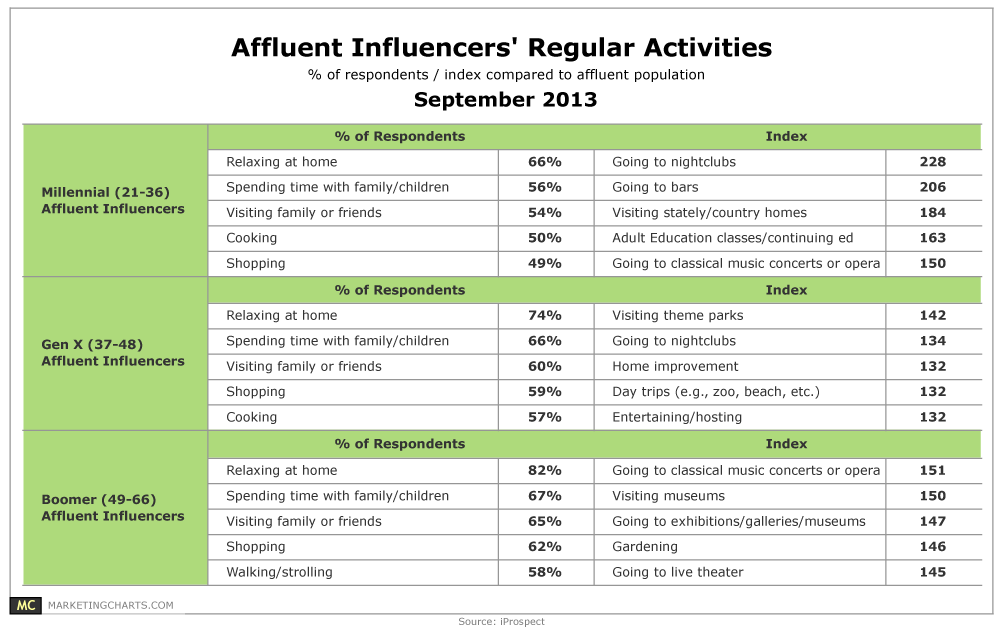
The most common activities are consistent across generations, with respondents most often enjoying relaxing at home, spending time with family, visiting family and friends, and shopping.
Read MoreTime Using Tablets By Activity, September 2013 [CHART]
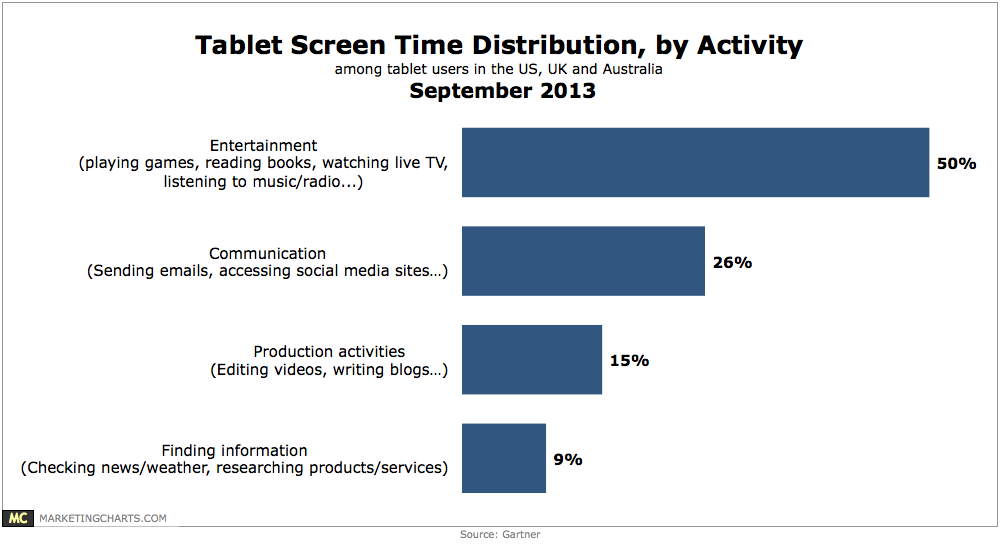
Tablet owners spend half of their device time with entertainment activities such as playing games, reading books, watching live TV or listening to music and radio.
Read MoreEffect Of Social Media Use On Customer Experience, September 2013 [CHART]
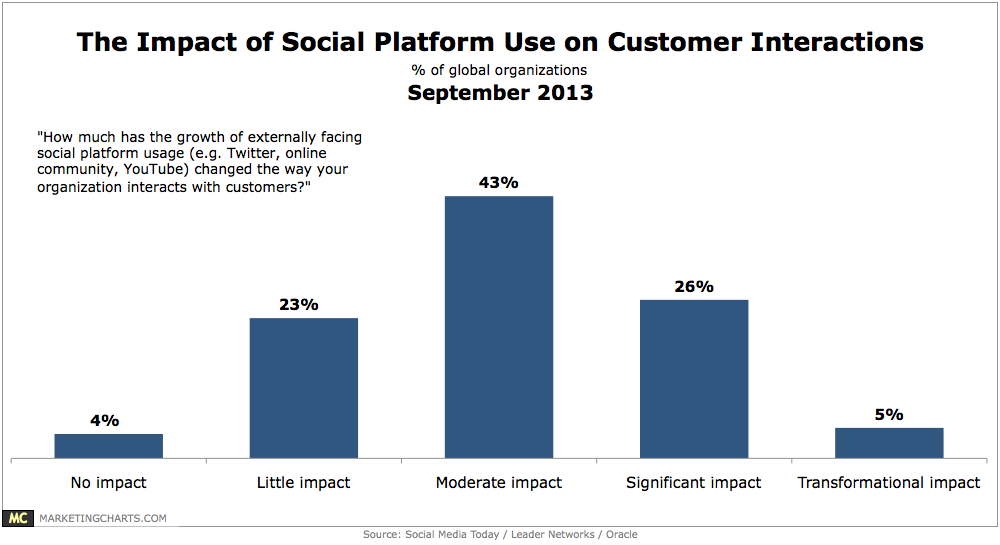
Asked how much the growth of social networks has changed the way their organization interacts with customers, 5% of respondents indicated a transformational impact.
Read MoreIT Buyers' Content Consumption, September 2013 [CHART]
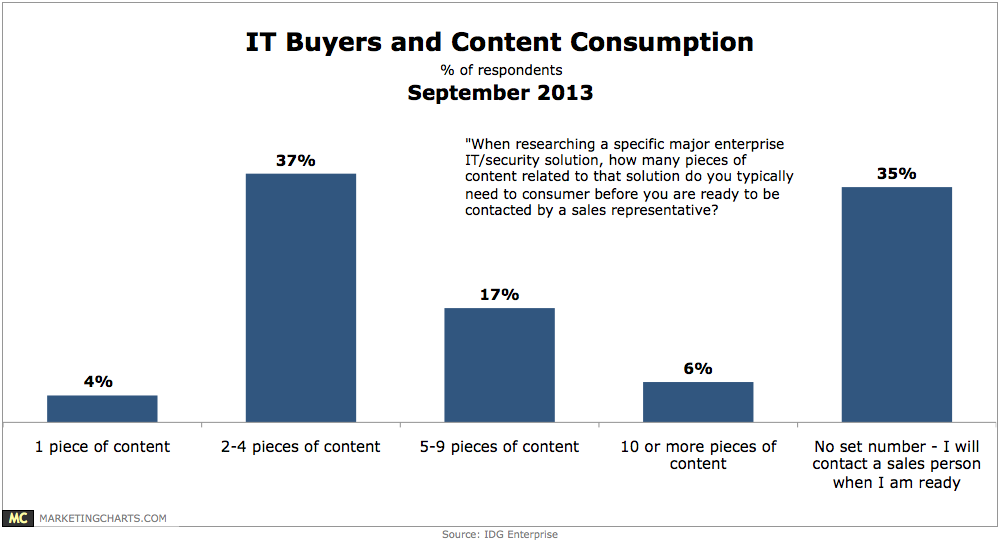
During the purchase process for major enterprise IT/security products and services, IT decision-makers download an average of 8 informational assets.
Read MoreMale Shopping Habits, September 2013 [TABLE]
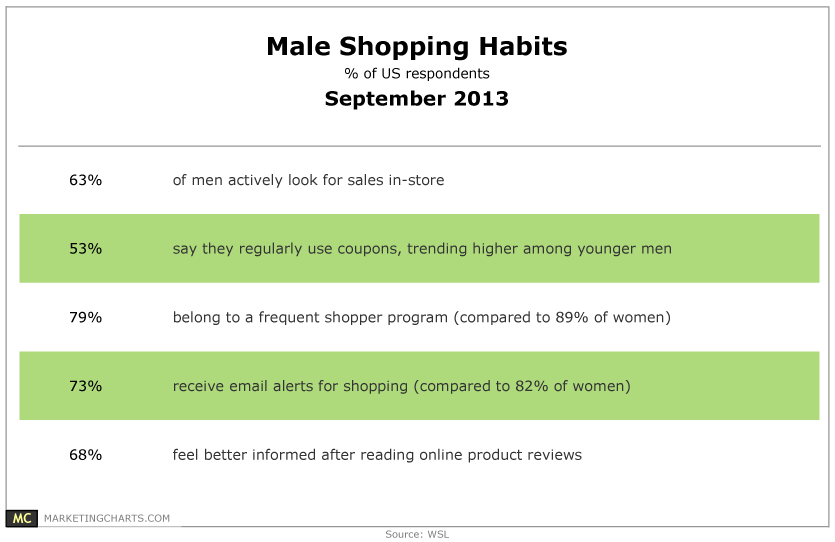
63% of men actively look for sales in-store and 53% regularly use coupons to cut costs, with that tendency slightly higher among younger men.
Read MoreSelect Content Types Women Consume Online By Platform, March 2013 [TABLE]
The tablet was in especially heavy rotation among women for lifestyles, retail and parenting content.
Read MoreTime Spent Online By Platform & Content Type, April 2013 [TABLE]

Plenty of online content areas were still firmly rooted in PC use, with the desktop accounting for more than 60% of time spent accessing auto, business, TV, news and sports content.
Read More