Consumer Behavior
How Brand Responses To Reviews Affect Consumer Perceptions, October 2013 [CHART]
7 in 10 say a brand’s response to an online consumer review changes their perception of a brand, most commonly by making them feel that the brand really cares about customers (41%).
Read MoreTop Omni-Channel Shopping Categories, October 2013 [CHART]
A majority of US shoppers combine online and in-person sources when purchasing in areas such as consumer electronics (70%) and toys (66%).
Read MoreMost Effective B2B Content Marketing Tactics, October 2013 [CHART]
93% of respondents now using content marketing (up from 91% last year) and 42% finding their efforts effective (up from 36%).
Read MoreMillennials’ Most-Loved Brands, Q2 2013 [TABLE]
Google saw its brand value jump 34% year-over-year, vaulting it into the second spot according to Interbrand’s list of the top 100 global brands.
Read MoreSocial Login Market Share, Q1 2012 – Q3 2013 [CHART]
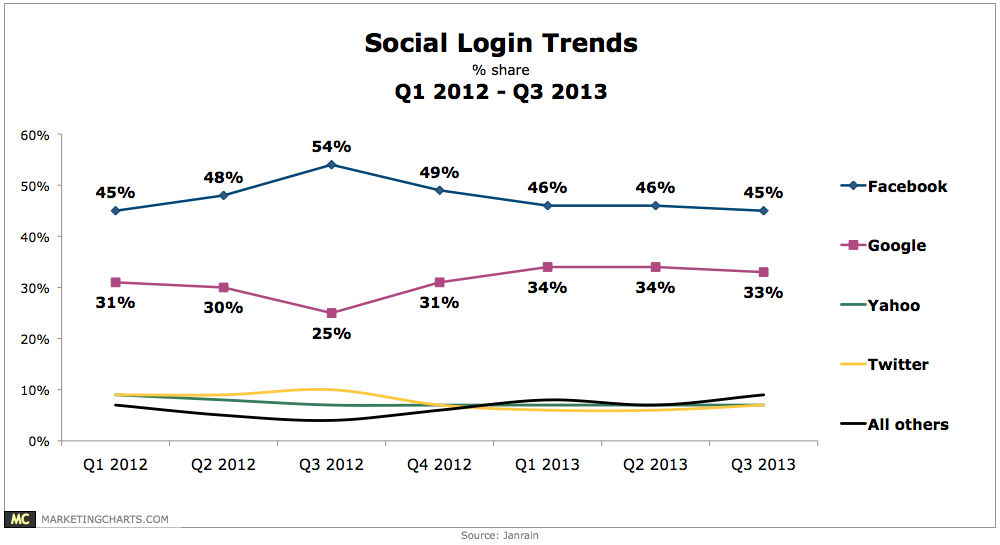
Facebook’s leading share slipped a point to 45%, a figure now 9% points lower than its majority share in Q3 2012.
Read MoreMobile Shopping Activities, October 2013 [TABLE]
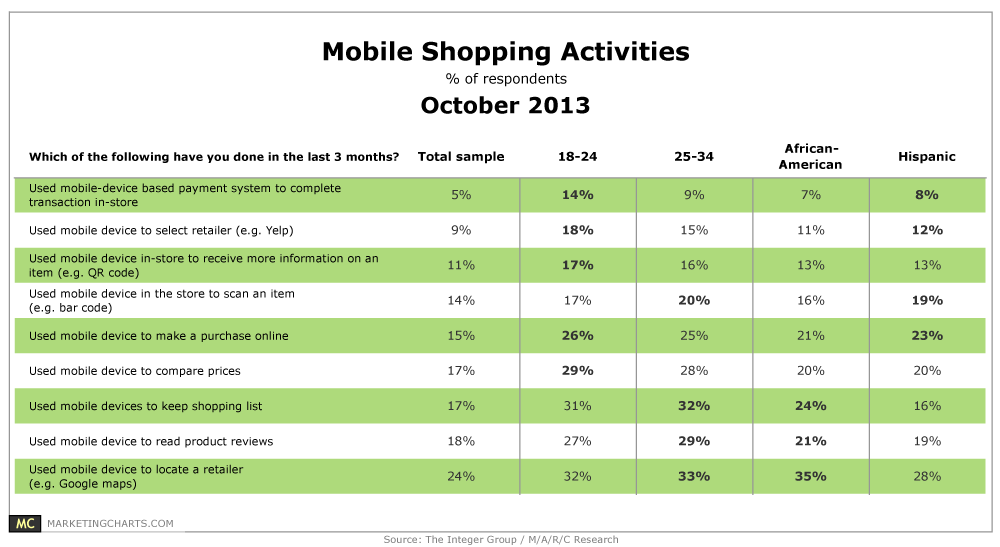
Young Americans are more likely than the average shopper to use their mobile devices for a range of shopping activities.
Read MoreAmerican Gamers Who Have Made In-Game Purchases By Game Type, Q2 2013 [CHART]
More than one-quarter of US web users reported having purchased through an app store a game that could be played via any device.
Read MoreGamers Who Play More Than 3 Games Per Week By Type, Q2 2013 [CHART]
More than half of adult US gamers played more than three Facebook games per week, and just fewer than half played at least that many mobile games.
Read MoreEffect Of Personal Value Perceptions On B2B Purchases, October 2013 [CHART]
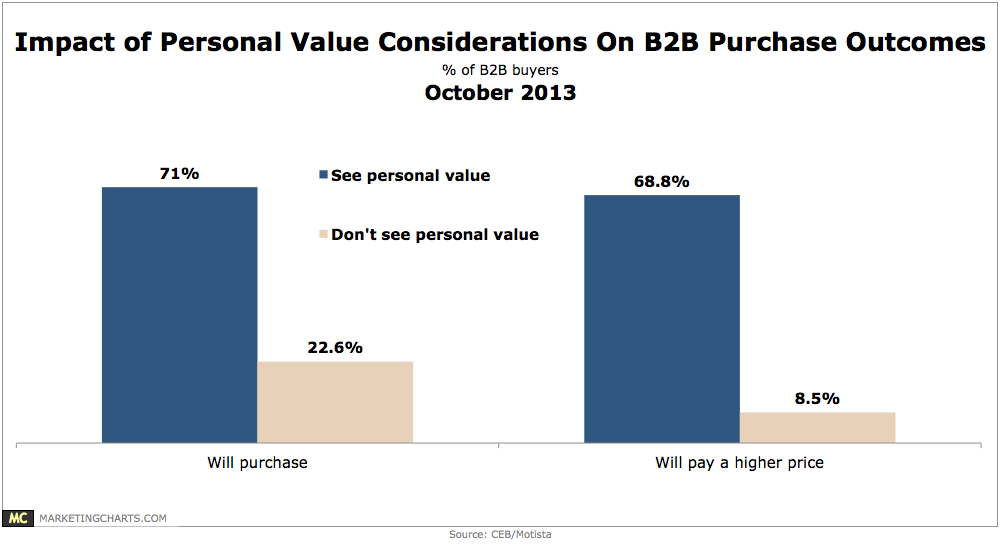
Those who see personal value are more than 3 times as likely to say they would make a purchase than those who do not recognize any personal value (71% vs. 22.6%).
Read MoreMillennials' Mobile Phone Dependence, October 2013 [CHART]
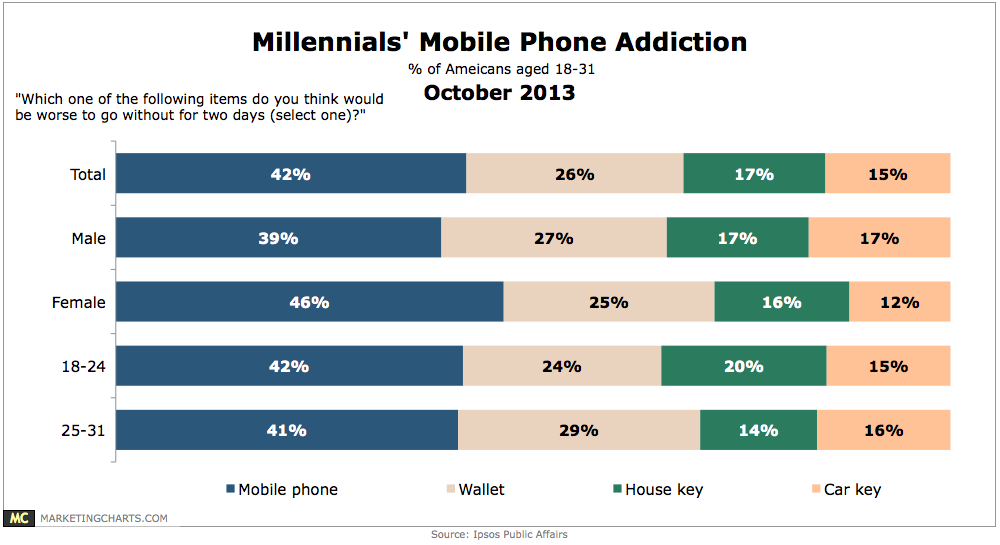
Asked which of 4 items – mobile phone, wallet, house key and car key – would be worse to go without for 2 days, a plurality 42% of American Millennials (aged 18-31) chose their mobile phone.
Read More