Consumer Behavior
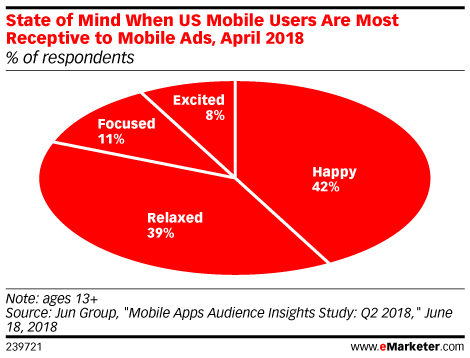
Mobile Gamers' Receptivity To Advertising [CHART]
Is mobile gaming a relaxing pastime? Nearly 40% of players think so, which is good news for mobile ad buyers, because many gamers say they tend to be more receptive to ads when they’re in a relaxed mood.
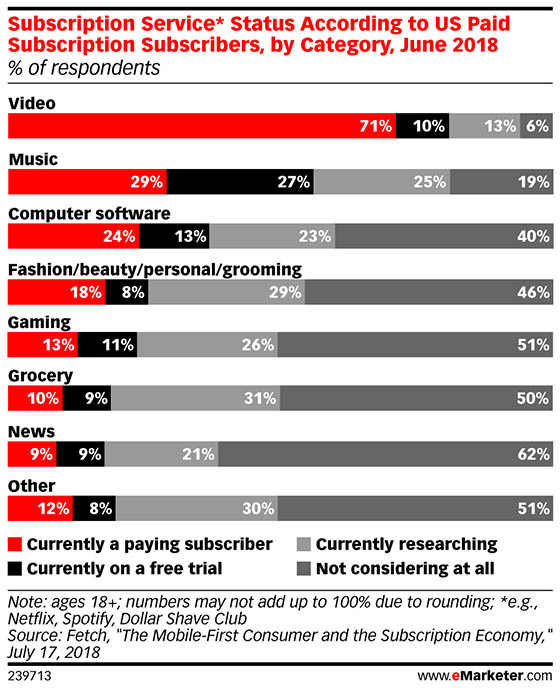
Read MoreSubscription Services Market Penetration [CHART]
Media subscription services for video, music and software have become so ingrained in our routines that for many, monthly fees are just a part of life. But consumers can only budget so much for these conveniences. Are media budgets squeezing out meal kits and other subscription box services?
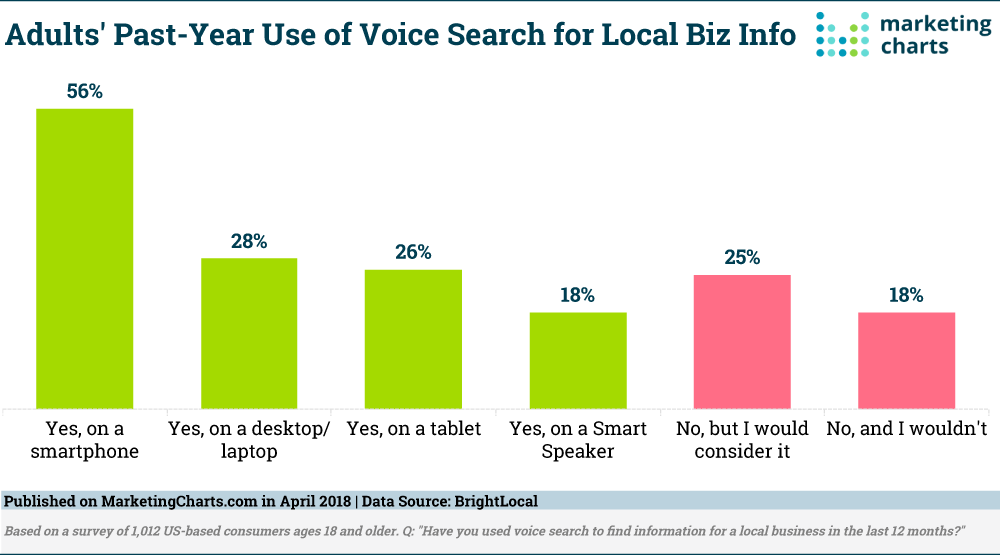
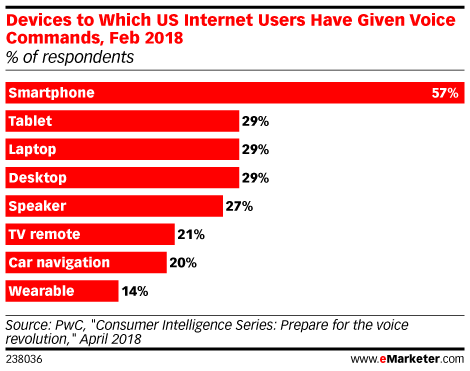
Read MoreLocal Business Voice Search By Device [CHART]
Some 58% of US adults have used voice search to find information on a local business at some point in the past 12 months. Most commonly, people are using their smartphones (56%) for voice search to find local business information, while about 1 in 5 (18%) have done so using a Smart Speaker.
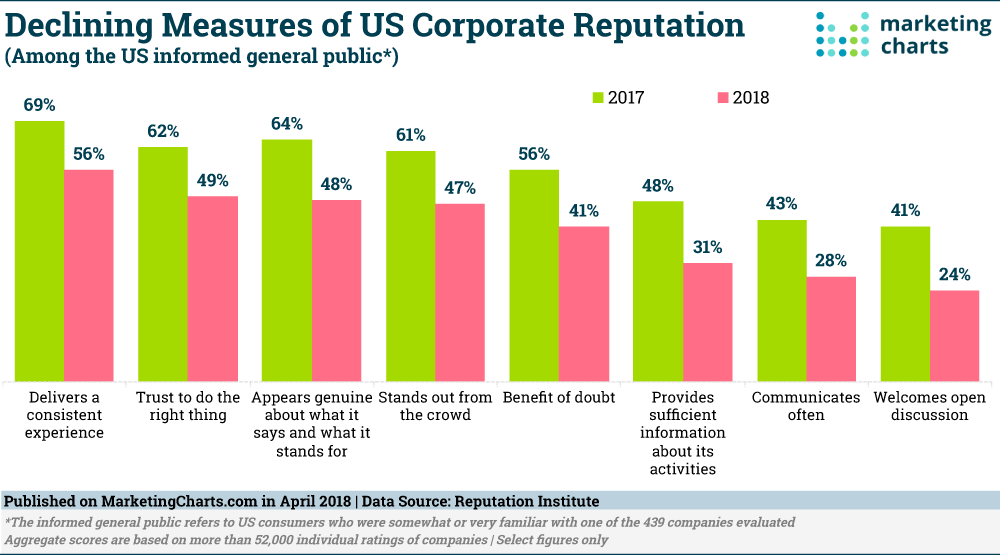
Read MoreFalling Corporate Reputation Factors [CHART]
Corporate reputations in the US have diminished this year compared to 2017. Only about half of consumers trust companies to do the right thing, down from 62% last year, and just 41% give companies the benefit of the doubt, down from 56% last year.
Read MoreGeneration V Tablet Activities [CHART]
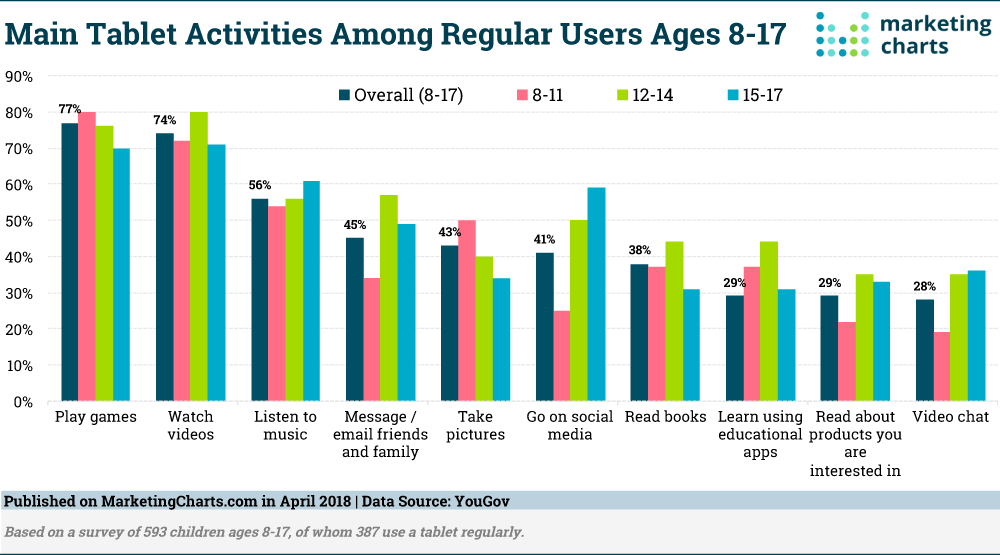
Some 65% of Gen V consumers report regular use of a tablet, according to a YouGov survey of almost 600 respondents ages 8-17. The results suggest that children ages 8-11 are the most frequent users (74% regularly using tablets), with regular usage tapering off among older kids.
Read MoreSmart Audio [VIDEO]
This presentation by Tom Webster of Edison Research presents the Spring 2018 edition of The Smart Audio Report from NPR and Edison Research. More than 43M people (18+) in the U.S. now own a smart speaker. And it’s no longer just the early adopters using these devices. New smart speaker owners are emerging as a distinct audience in terms of user profile, behavior and media habits.
Read MoreImportant vs Well-Executed Restaurant Technologies [TABLE]
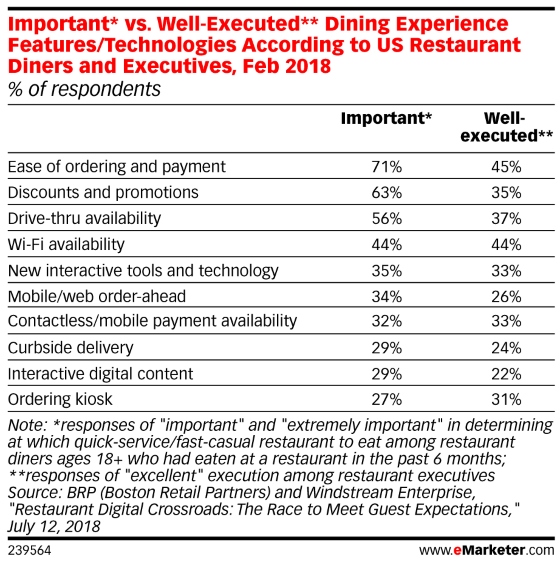
In a February 2018 survey of US internet users and restaurant executives by BRP (Boston Retail Partners) and Windstream Enterprise, restaurant operators met consumer expectations on only two factors: contactless/mobile payment, for which 32% of consumers valued it and one-third of operators offered it, and Wi-Fi availability (44% both valued it and offered it).
Read MoreVoice-Activated Shopping Behavior [CHART]
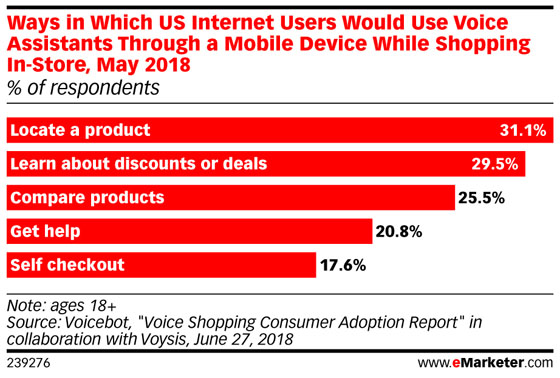
Nearly 21% of shoppers said they would ask their voice assistant for in-store help, while 17.6% would use their voice assistant to self-checkout.
Read MoreVoice-Activated Device Use [CHART]
eMarketer’s latest forecast expects the number of smart speaker users to rise at a compound annual growth rate (CAGR) of 47.9% between 2016 and 2020, from 16.0 million to 76.5 million.
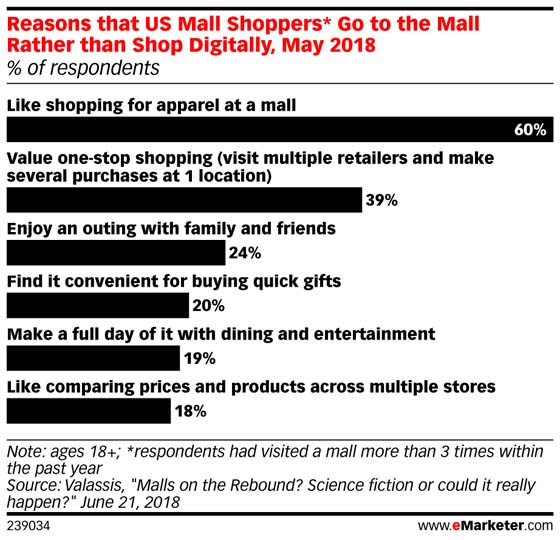
Read MoreWhy People Go To The Mall [CHART]
It’s true, merchants can no longer rely on traditional anchors—usually department stores—to attract crowds. According to Coresight Research, the number of full-line department stores will shrink to 4,750 by 2023, down 19.5% from 2017.
Read More