Consumer Behavior
Professional Activities Conducted On Social Media By UK Business Pros, January 2014 [CHART]
72% of UK business pros consider LinkedIn it a trustworthy source of professional content—compared with 37% for Facebook and 30% for Twitter.
Read MoreUS B2C mCommerce Sales Share By Segment, 2012-2018 [CHART]
In 2013, travel totaled 34.1% of the nearly $400 billion US eCommerce market.
Read MoreUS Online Travel Sales By Channel, 2012-2018 [CHART]
US mobile travel sales totaled $16.36 billion in 2013 and will increase another 59.8% this year to reach $26.14 billion.
Read MoreSmart Phone Commerce Metrics By Day Of The Week, Q1 2014 [CHART]
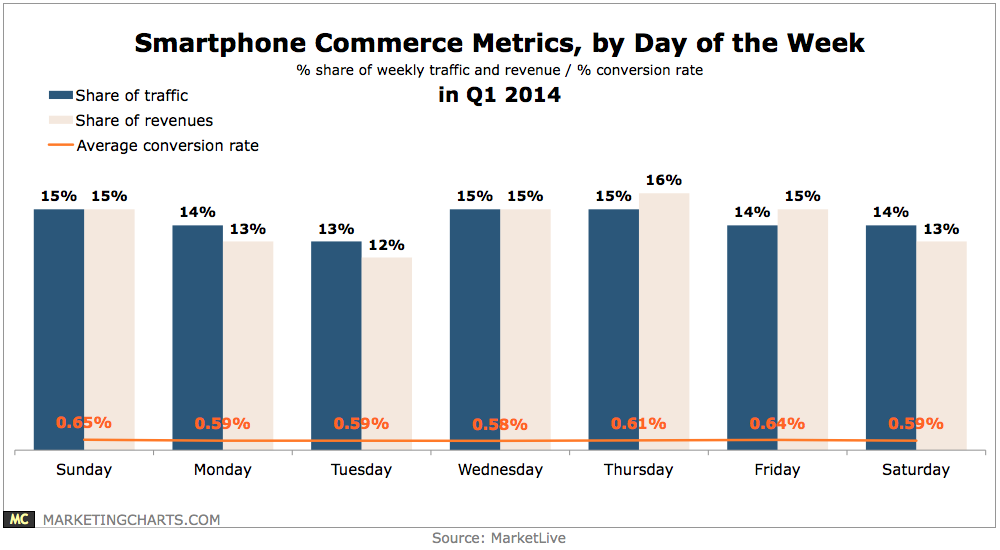
Mondays and Saturdays tied for the second-largest share of weekly revenues (15% each).
Read MoreTablet Commerce Metrics By Day Of The Week, Q1 2014 [CHART]
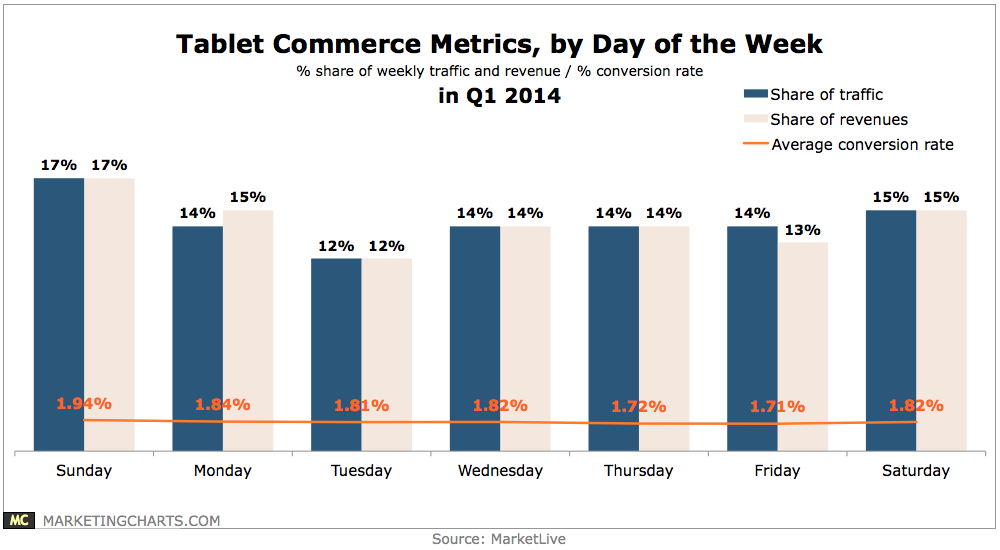
Mobile accounted for 10.5% of retail e-commerce spending last year.
Read MoreCustomer Experience Leaders vs Laggards, May 2014 [TABLE]
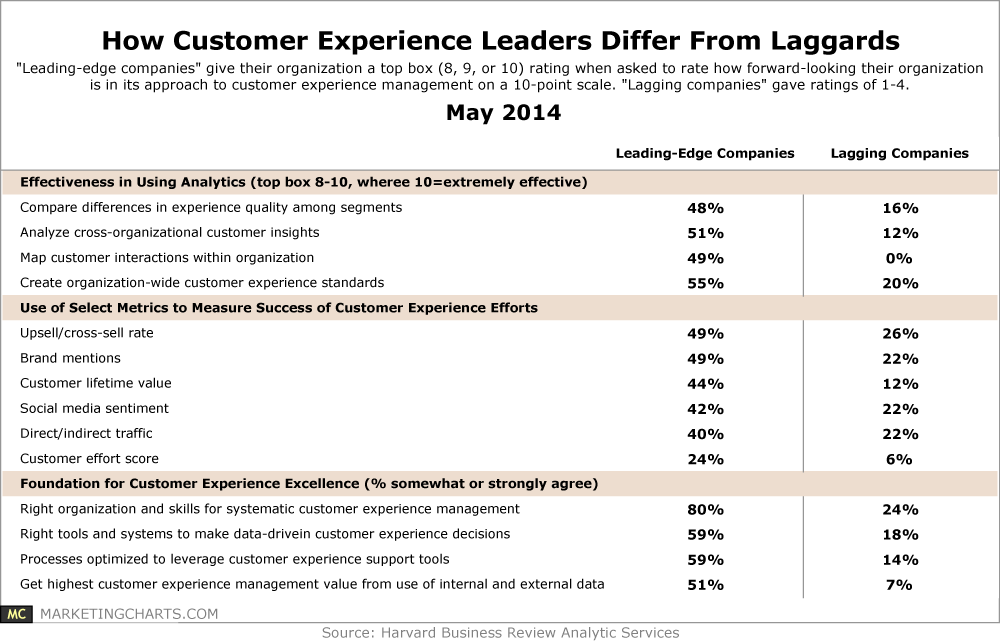
58% believe their customer retention rates are very successful (top-3 box score on a 10-point scale), versus just 20% of lagging companies who concur.
Read MoreNumber Of TV Channels Average Household Watches, 2008-2013 [CHART]
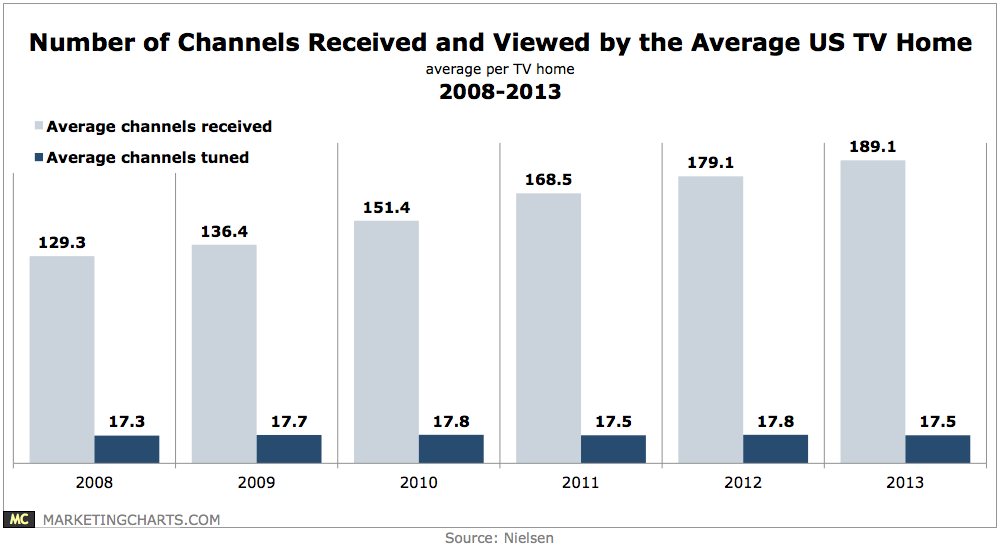
The number of channels watched by the average US TV home has remained between 17 and 18 each year since 2008, despite an ever-growing number of channels received by the average TV home.
Read MoreUK Online Shoppers' Attitudes Toward Email Personalization, March 2014 [CHART]
The research asked UK adult digital shoppers how they felt branded emails could become even more appealing. The key sentiment was personalization.
Read MoreMarketing Channels UK Consumers Prefer For Contact By Age, February 2014 [TABLE]
Email was the preferred marketing channel among UK internet users across all age groups.
Read MoreBenefits Of Innovation Labs & Product Incubators, 2013 & 2014 [CHART]
The number of agencies and client-side marketing firms with innovation labs and product incubators jumped more than 28% year over year in 2014 to 50%, from 39% in 2013.
Read More