Consumer Behavior
Influence Of Online Platforms Over User Behavior [CHART]
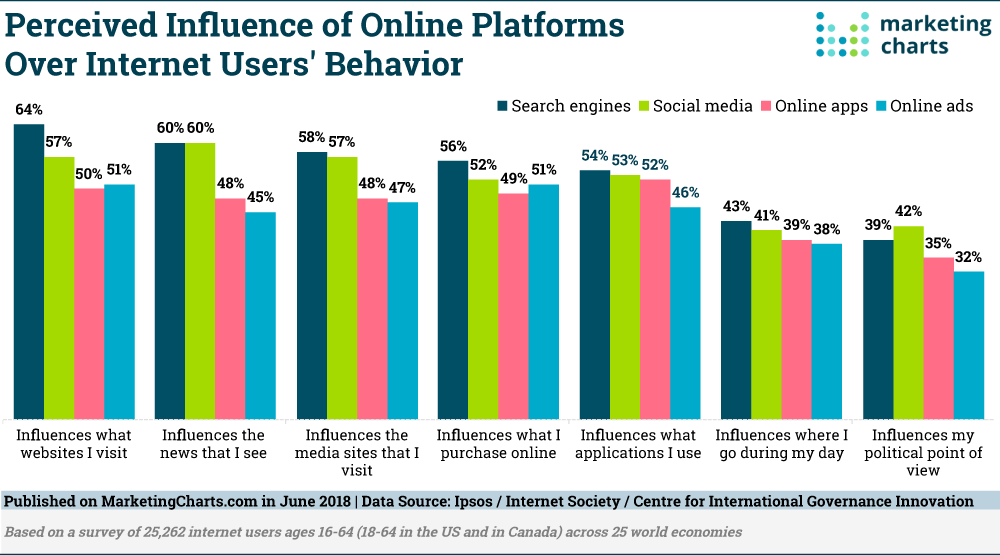
A slight majority (52%) of people around the world say they’re more concerned about their online privacy than they were a year ago, according to a report from Ipsos, the Internet Society and the Centre for International Governance Innovation (CIGI).
Read MoreImportance Of Mobile Apps By Generation [CHART]
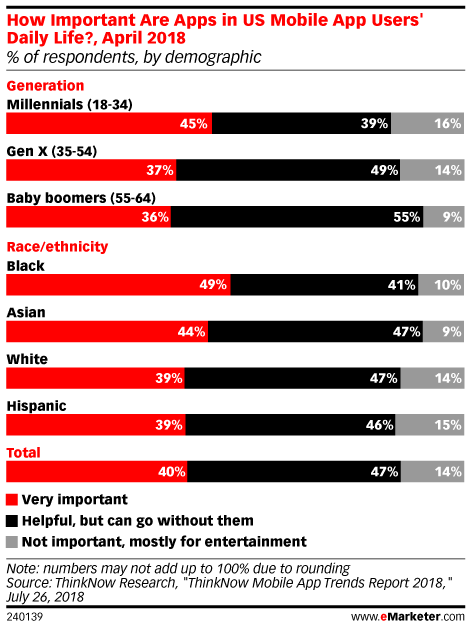
In an April 2018 survey by ThinkNow Research, 40% of US mobile app users said apps were Very Important in their daily life. Millennials were slightly more likely to feel this way, though not by much.
Read MoreTrust In Retailer Data Security [CHART]
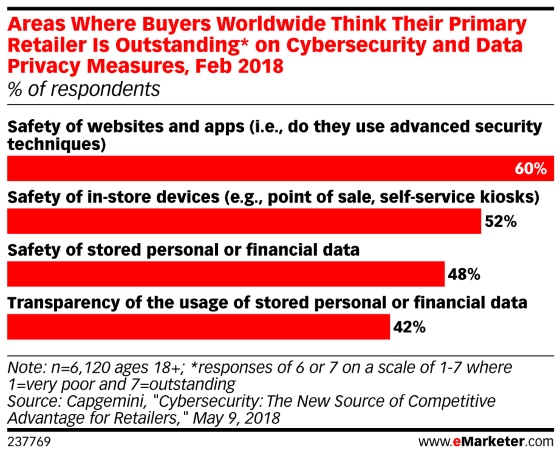
Worldwide, 46% of consumers don’t believe (or are unsure) that businesses sell their personal data, but 43% of businesses overall said they engage in this practice.
Read MoreAverage Net Promoter Score By B2C Industry [CHART]
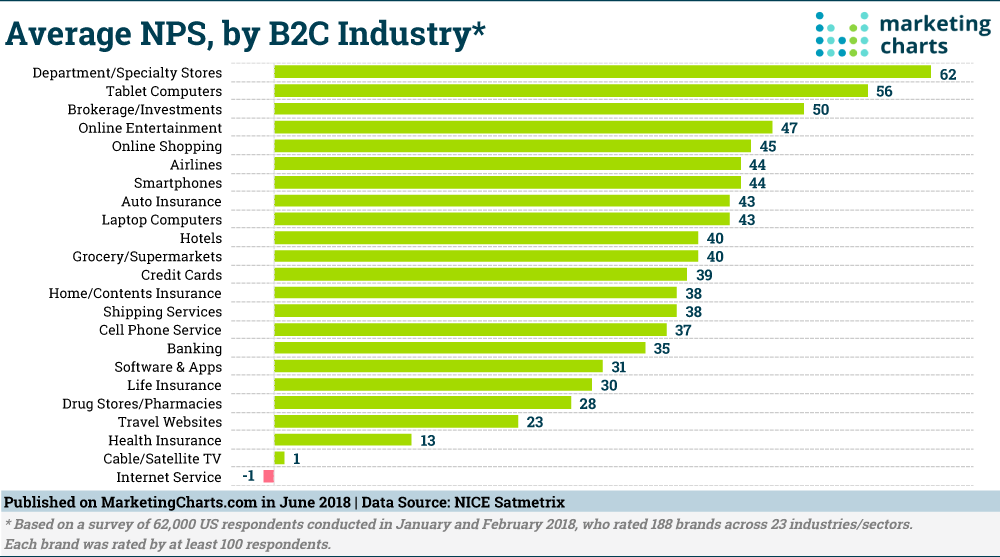
Which B2C industries and brands enjoy the highest net promoter scores (NPS)? NICE Satmetrix, one of the co-developers of this metric, asked 62,000 Americans to rate 188 brands across 23 industry sectors.
Read MoreOut Of Home TV Viewing By Generation [CHART]
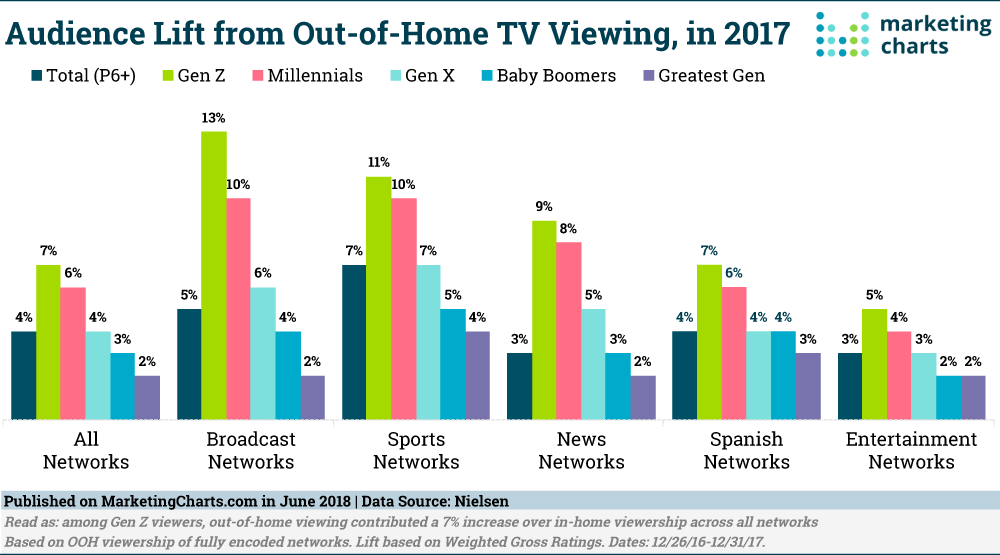
Young people are watching less traditional TV in the home – that much is clear. But data from Nielsen indicates that they haven’t abandoned their interest in linear TV.
Read MoreWho Benefits Most From Personal Data? [CHART]
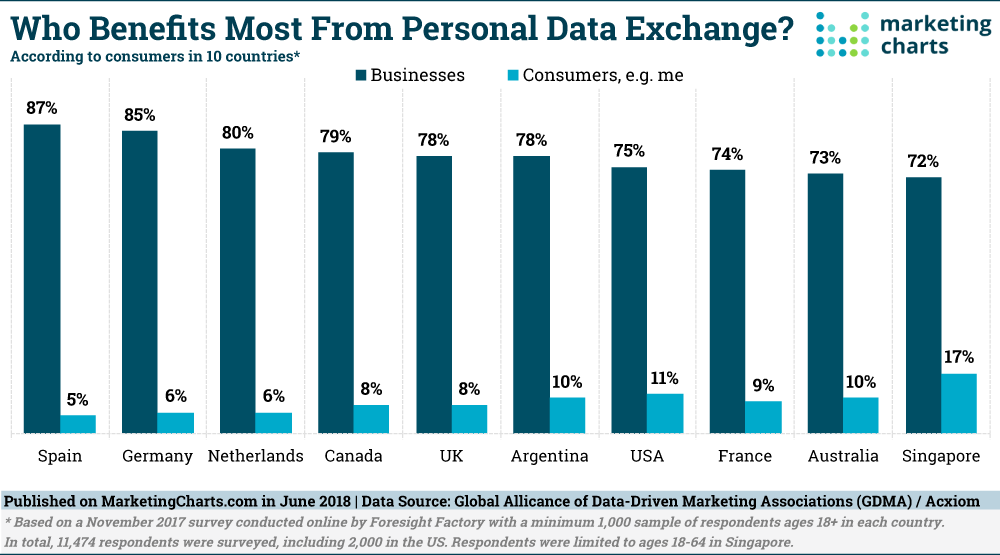
Privacy is obviously a hot topic these days with new European data privacy regulations going into effect and Facebook facing questions over its privacy practices.
Read MoreTraditional Media Consumption By Channel, 2011-2018 [CHART]
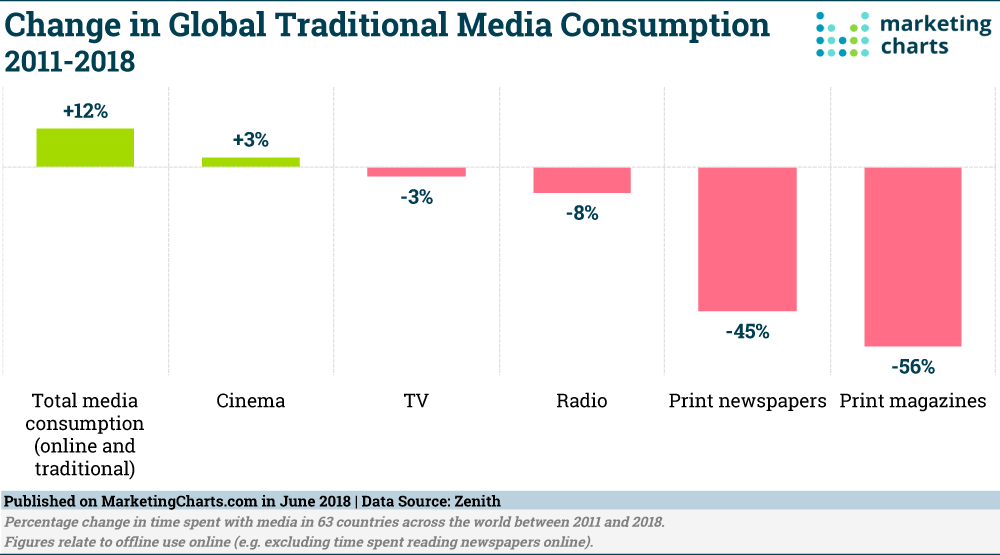
People around the world are expected to spend about 8 hours a day consuming media this year, representing a 12% jump from 2011.
Read MoreMost Popular Voice Activated Activities [CHART]
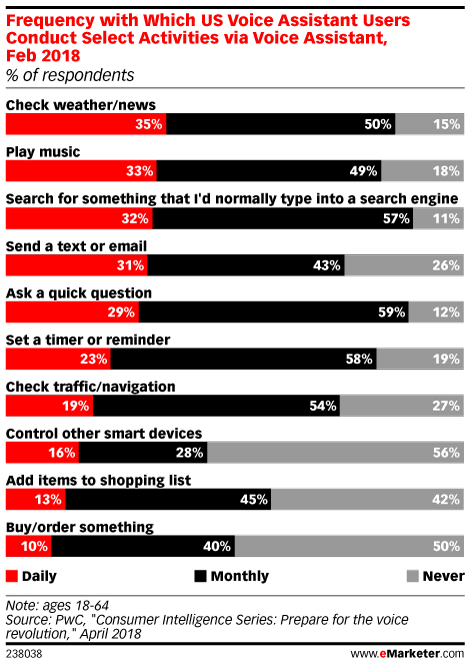
Research conducted in the US by PwC in February 2018 found that searching for information, playing music, sending messages and shopping were among the activities conducted by large percentages of voice assistant users.
Read MoreTop 100 Non-Brand Keywords At Google [INFOGRAPHIC]
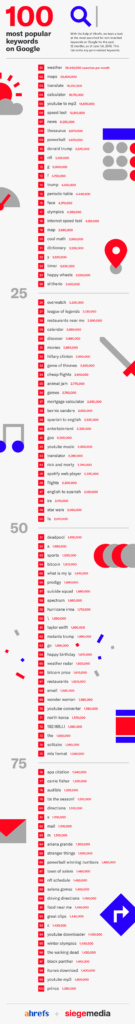
This infographic from siegemedia illustrates the top 100 non-brand keywords used at Google for the year prior to June 1, 2018.
Read MoreParents' & Teens' Screen Time [CHART]
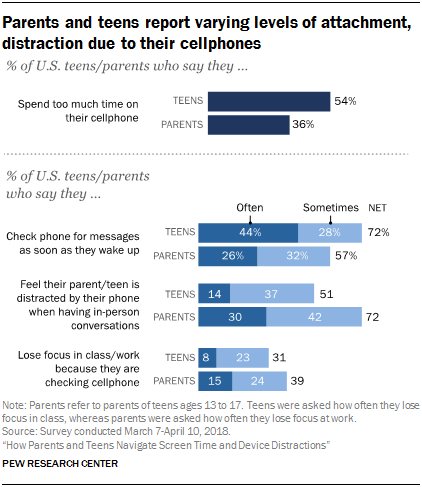
Amid roiling debates about the impact of screen time on teenagers, roughly half of those ages 13 to 17 are themselves worried they spend too much time on their cellphones.
Read More