Consumer Behavior
Share Of Online Nonprofit Donations By Sector & Source, 2013 [CHART]
Email open rates, clickthrough rates, page completion rates—and as a result, email response rates—were all down for US nonprofits last year.
Read MoreGlobal Executives' Top Sources Of Industry News, June 2014 [CHART]

A majority of global executives rely on email newsletters for industry-specific news.
Read MoreForm Conversion Rates By Type, June 2014 [CHART]
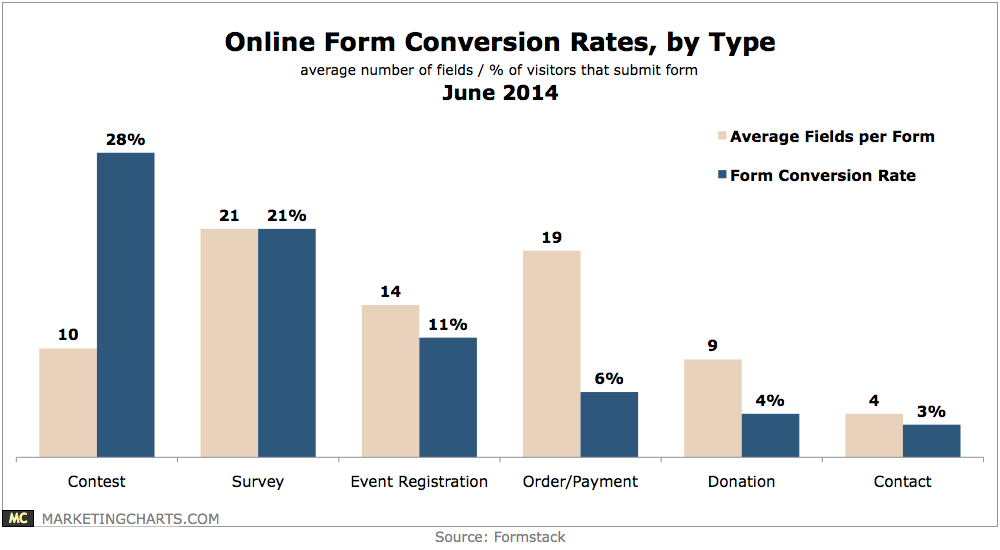
The average conversion rate for forms in the US is 7%.
Read MoreCord-Cutting Intent Among Adult Broadband Users, 2011-2014 [CHART]
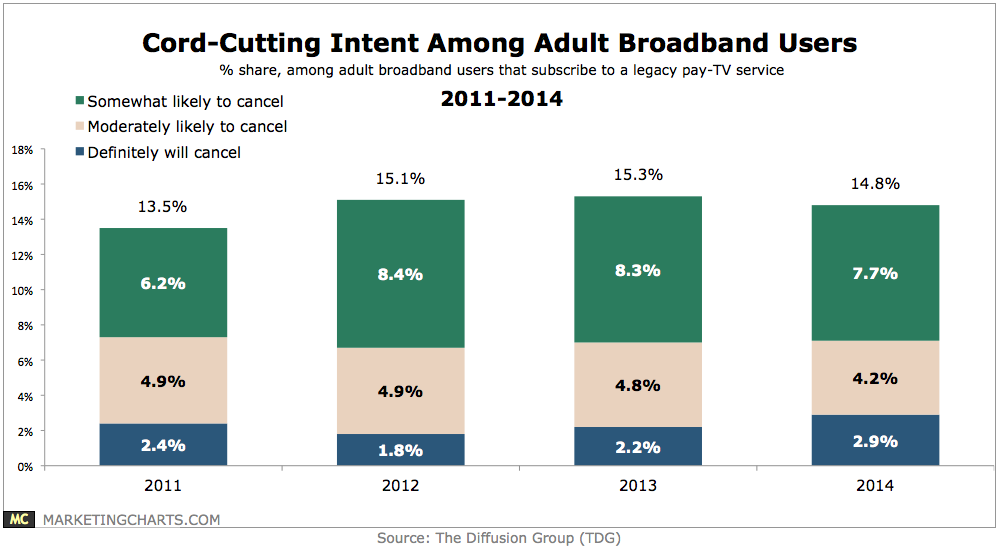
Customer satisfaction with pay-TV providers is at a multi-year low, but that doesn’t appear to be affecting subscriptions.
Read MoreHispanic Daily Tablet Users By Generation, March 2014 [CHART]
Hispanic Gen Xers overwhelmingly lead in daily tablet content consumption.
Read MoreMobile Hispanics' Device Ownership, March 2014 [CHART]
Among Hispanics, the millennial generation may lead in smartphone ownership and usage, but it’s the Gen Xers who dominate in daily tablet use.
Read MoreAmazon Prime Spending vs Non-Prime Customers [CHART]
People who subscribe to Amazon Prime spend a lot more than non-Prime members.
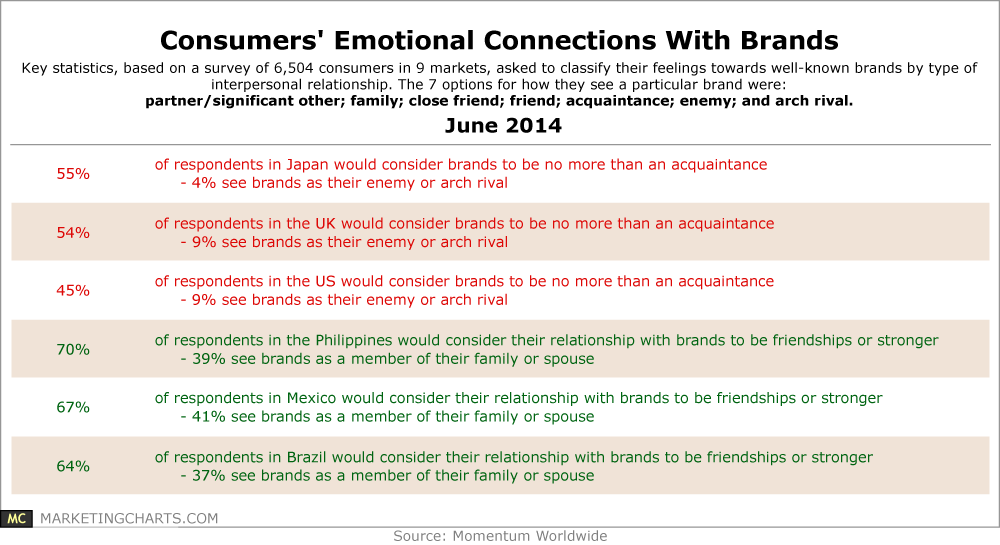
Read MoreConsumers Emotional Connections To Brands, June 2014 [TABLE]
Consumers in the US are among the most emotionally distant from brands.
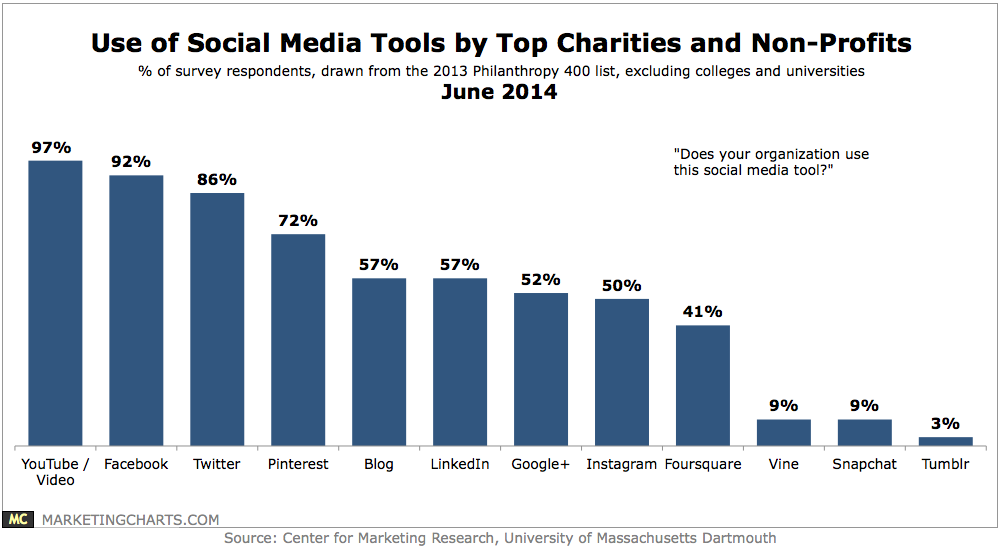
Read MoreSocial Channels Top Charities & Non-Profits Use, June 2014 [CHART]
Social media use is almost ubiquitous among top charities and non-profits, with 98% using at least one platform.
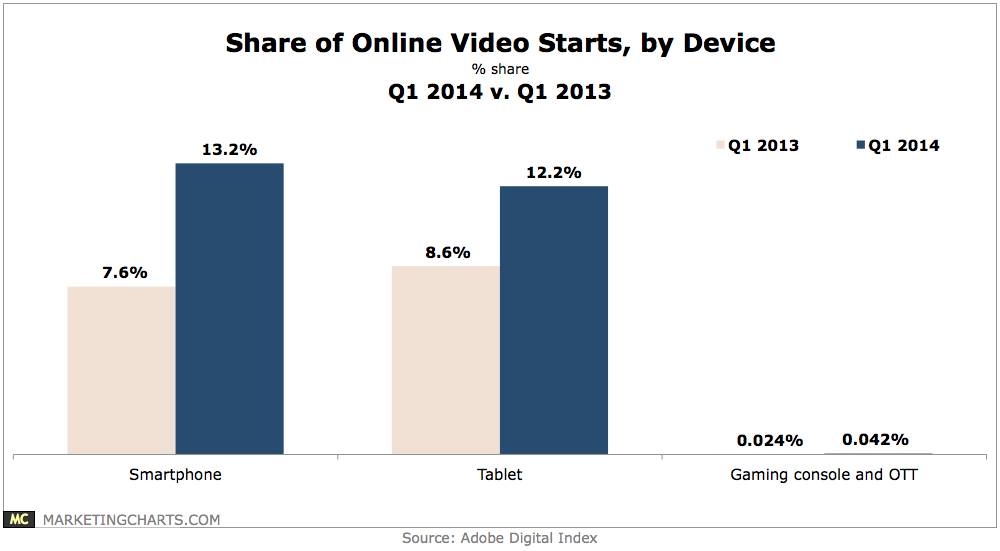
Read MoreShare Of Online Video Starts By Device, Q1 2013 vs Q1 2014 [CHART]

Smartphones (13.2%) and tablets (12.2%) combined to account for one-quarter of digital video starts in Q1, up from 16.2% a year earlier.
Read More