Consumer Behavior
Consumers Willing To Pay For Overnight Delivery Of eCommerce Purchases, June 2014 [TABLE]
Female and older internet users were the least willing to pay more for same-day and overnight delivery when shopping online.
Read MoreOnline Shopping Pet Peeves By Generation, June 2014 [TABLE]

Among US internet users surveyed who had at least one digital shopping pet peeve, shipping costs were the most common, cited by 66% of respondents.
Read MoreSmart Home Device Ownership & Interest, May 2014 [CHART]
Most US internet users (85.0%) do not own a single smart home device.
Read MoreHighly Anticipated Internet Of Things Technologies, May 2014 [CHART]
73% of US adults were unfamiliar with the concept of the Internet Of Things.
Read MoreDigital Wallet Users By Age & Gender, July 2014 [CHART]
While more than 8 in 10 US adult smart phone users are aware of digital wallets, only about one-third have used one.
Read MoreConsumer Spending & Savings Trends, July 2014 [CHART]
Some 83% of respondents reported having purchased generic or store brand goods during the 4 weeks prior to the survey.
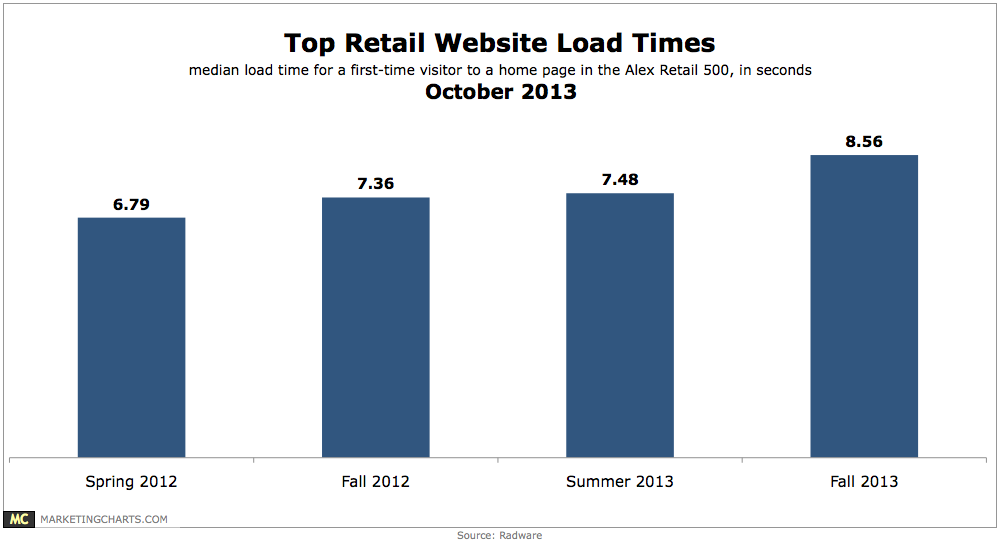
Read MoreTop Retail Brands' Site Load Speeds, 2013 – 2014 [CHART]
The median load time for home pages of the top 100 US retail websites has slowed yet again on a year-over-year basis.
Read MoreMobile Email Use By OS, April 2014 [CHART]
One-quarter of marketers planned to increase spending on email marketing.
Read MoreMost Effective Online Channels For Customer Retention, Q2 2014 [CHART]
86% of US digital marketers used email marketing regularly—the highest response rate out of all programs listed.
Read MoreBest Days To Reach IT Executives, July 2014 [CHART]
It takes 222 calls or emails on average to secure a qualified appointment with an IT executive.
Read More