Consumer Behavior
Average Monthly Of Mobile Game Downloads, February 2014 [CHART]
The 18-to-24 age group downloaded the most games on a monthly basis, with an average of 2.87.
Read MoreAverage Monthly Spending On Mobile Games By Segment, February 2014 [CHART]
The smartphone gaming audience will see faster growth in 2014 and all the way through 2018.
Read MoreMillennial Content Sharing By Category & Channel, April-July 2014 [CHART]
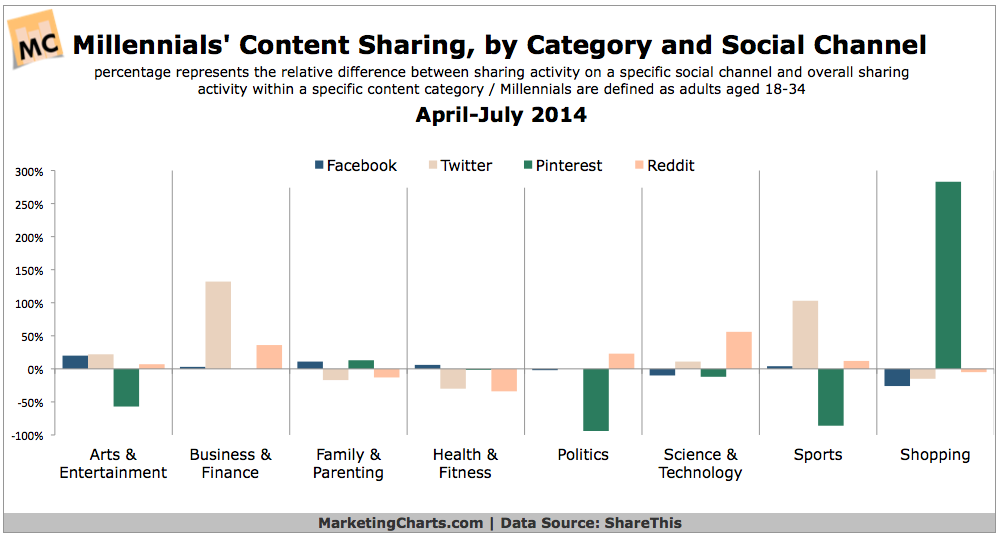
Millennials (18-34) are far more likely than the general population to share content on social networks and to click on shared content.
Read MoreConsumer Expenditures, 2012 vs 2013 [CHART]
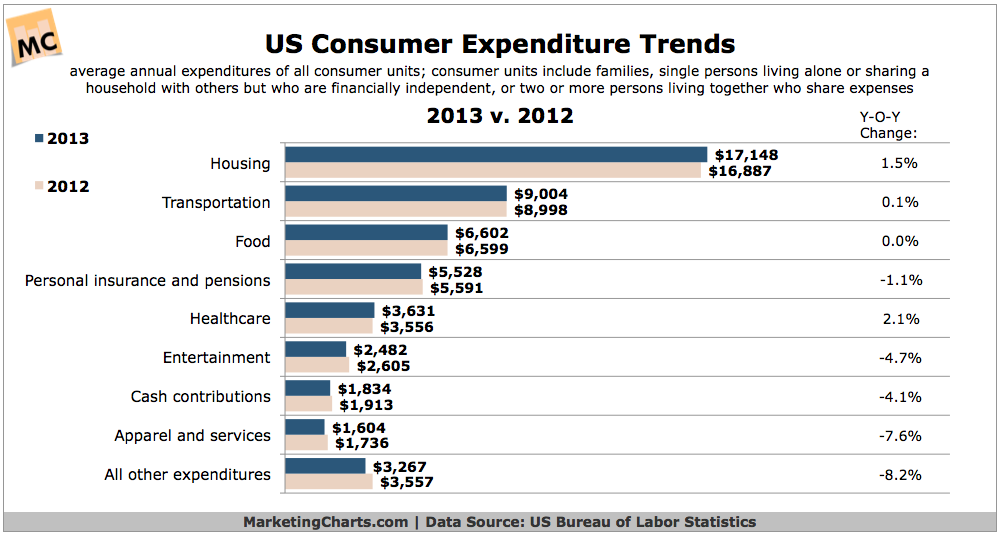
Consumers spent more on housing and transportation but less on apparel and entertainment in 2013, details the US BLS in a recent data release.
Read MoreEmail Open & Click-Through Rates, 2010-2014 [CHART]
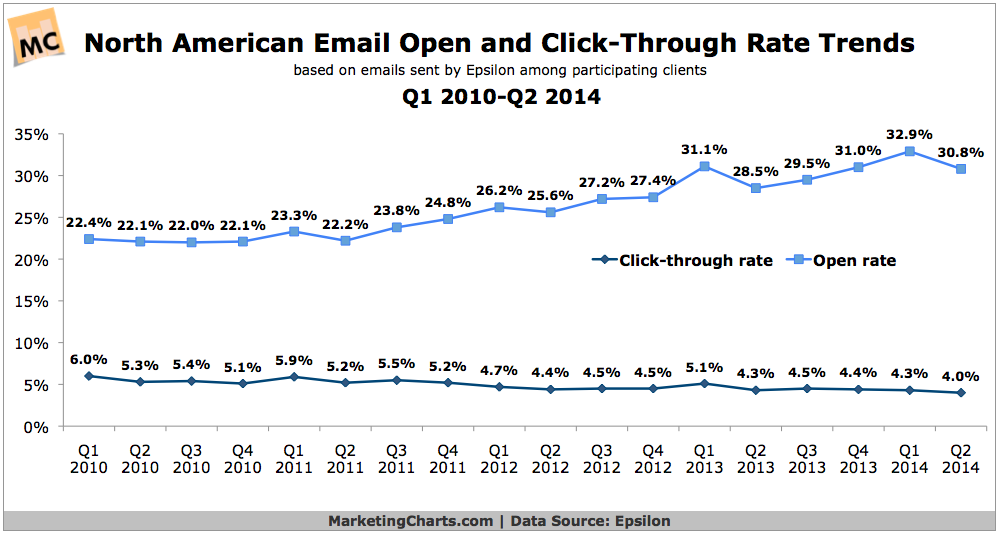
Email open rates declined on a quarter-over-quarter basis in Q2 to 30.8%, although they remain up from the year-earlier period (28.5%).
Read MoreThe Life Of A B2B Sales Representative [INFOGRAPHIC]

This infographic from Qvidian illustrates the life and struggles a B2B sales representatives face on the job.
Read MoreBrand Attributes Millennials Most Covet, September 2014 [CHART]
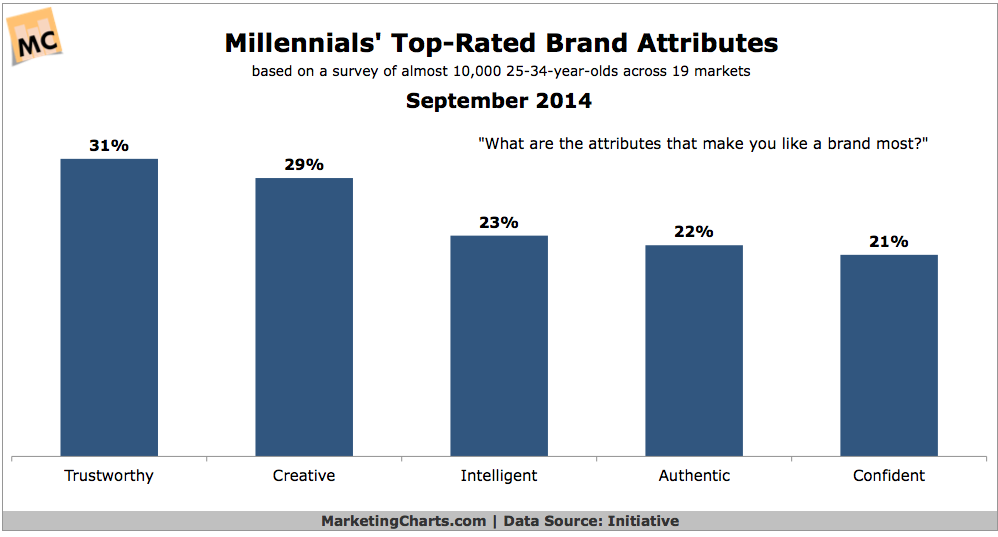
Three in 10 Millennials (aged 25-34) around the world are cynical about the way brands market to them, and that figure rises above 40% in the US and UK.
Read MoreEffect That Social TV Has On TV Show Follower Growth, September 2014 [CHART]
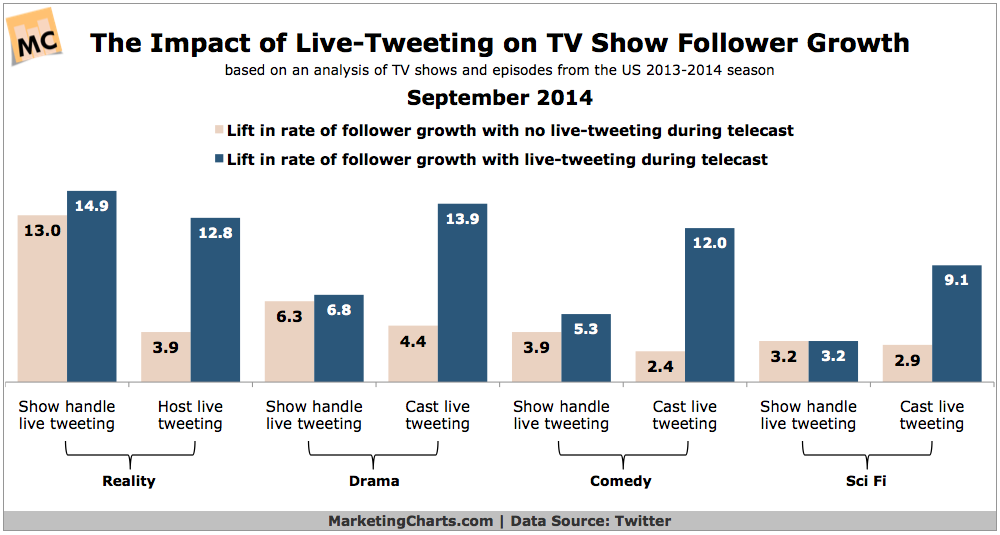
TV shows that live-tweet have a better follower growth rate than those that don’t.
Read MoreAffluent Americans' Consumer Spending By Category, September 2014 [CHART]

Some 67.5 million American adults lived in a household with annual income of at least $100,000, a 5 million (or 8%) increase from last year.
Read MoreOffers In Retail Mobile Ads To Which Users Are Likely To Respond, June 2014 [CHART]
Mobile users were most likely to engage with mobile retail ads before they shopped, cited by 73% of respondents.
Read More