Consumer Behavior
Frequency of Social Media Use By Top Social Networks [CHART]

Fully 70% say they use Facebook daily (including 45% who do so several times a day), a significant increase from the 63% who visited daily in August 2013.
Read MoreLinkedIn Demographics [TABLE]
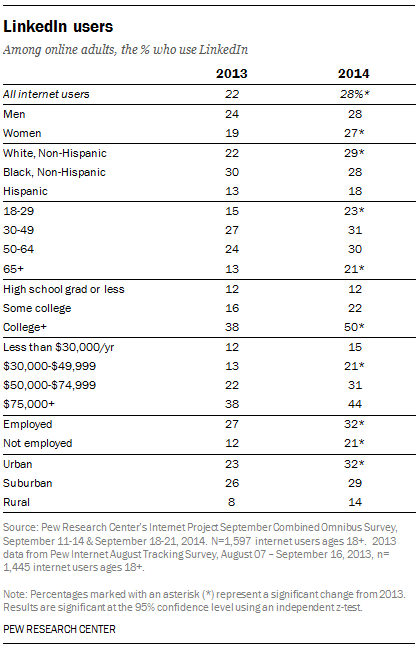
Some 28% of online adults are LinkedIn users, up from 22% in August 2013.
Read MorePinterest Demographics [TABLE]
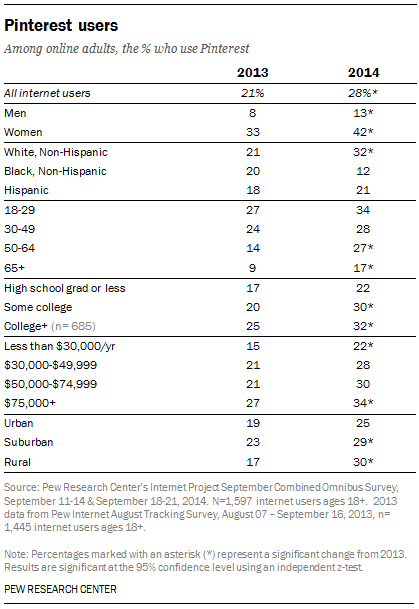
Some 28% of online adults use Pinterest, up from the 21% who did so in August 2013.
Read MoreInstagram Demographics [TABLE]

Some 26% of online adults use Instagram, up from 17% in late 2013.
Read MoreTwitter Demographics, 2013 & 2014 [TABLE]
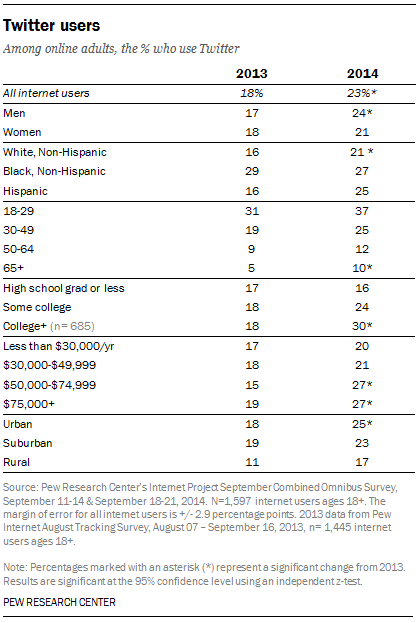
Some 23% of online adults currently use Twitter, a statistically significant increase compared with the 18% who did so in August 2013.
Read MoreSocial Media Adoption By Site, 2012-2014 [CHART]

LinkedIn saw significant increases over the past year in the proportion of online adults who now use their sites.
Read More2015 Social Media Image Sizes [INFOGRAPHIC]

This infographic from ConstantContact serves as a handy guide for images specifications for the major social sites.
Read MoreHow Gamers Want To Get Their Video Games, October 2014 [CHART]
Video gamers were most interested in a Netflix-style service for digital downloading.
Read MoreGamers Who Have Downloaded A Video Console Game, October 2014 [CHART]
About half of US video gamers who owned an internet-connected console like PlayStation or Xbox had paid for a game via digital download in the past year.
Read MoreUS Tablet Video Viewers, 2013-2018 [TABLE]
The size of the US tablet video-viewing audience is nearly as large as that of the smartphone video-viewing audience.
Read More