Consumer Behavior
Social Authority Affects Google's Tweet Indexation [CHART]
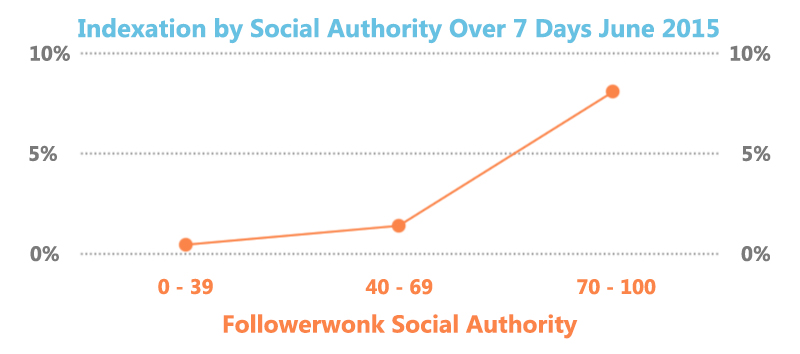
Google is looking at more than simple follower count to pick out what tweets they want to index.
Read MoreTop Audience Targeting Types For Branding, May 2015 [CHART]
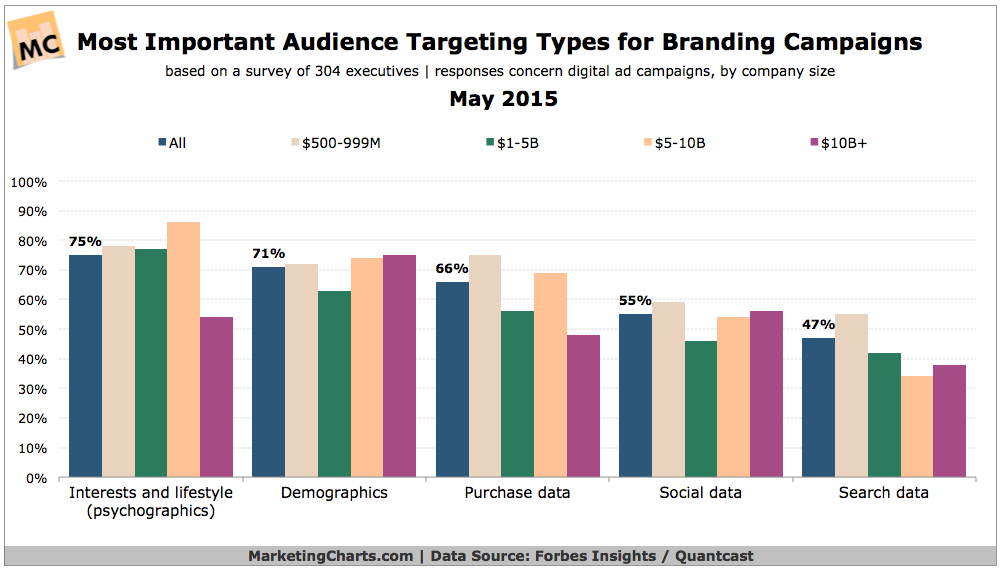
Psychographics (such as interests and lifestyle) and demographics are the most important types of audience targeting for digital branding campaigns.
Read MoreConsumer Confidence In Retailers’ Data Security, May 2015 [CHART]
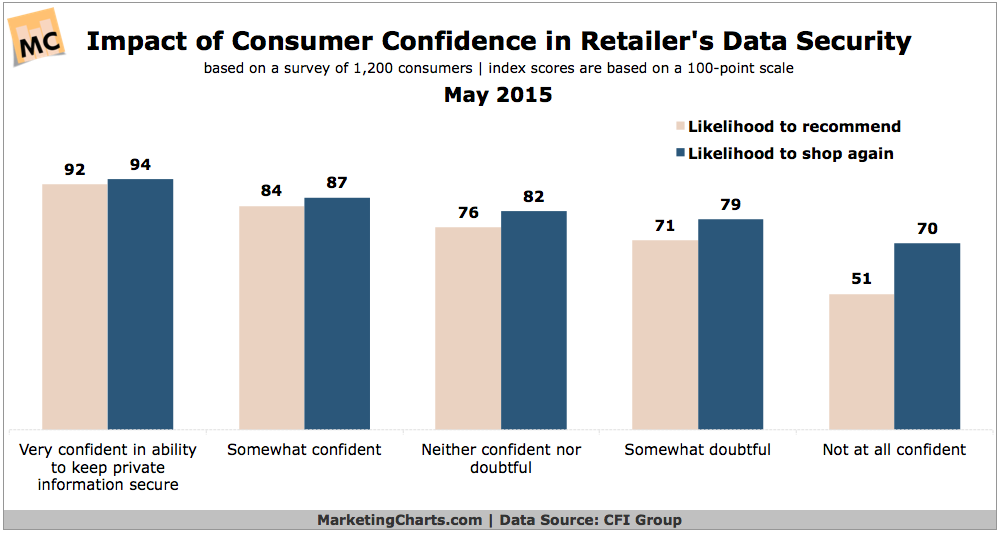
Slightly fewer than one-third of consumers say they are ‘very confident’ in retailers’ ability to keep their private information secure.
Read MoreWhy People Download Mobile Apps, May 2015 [CHART]
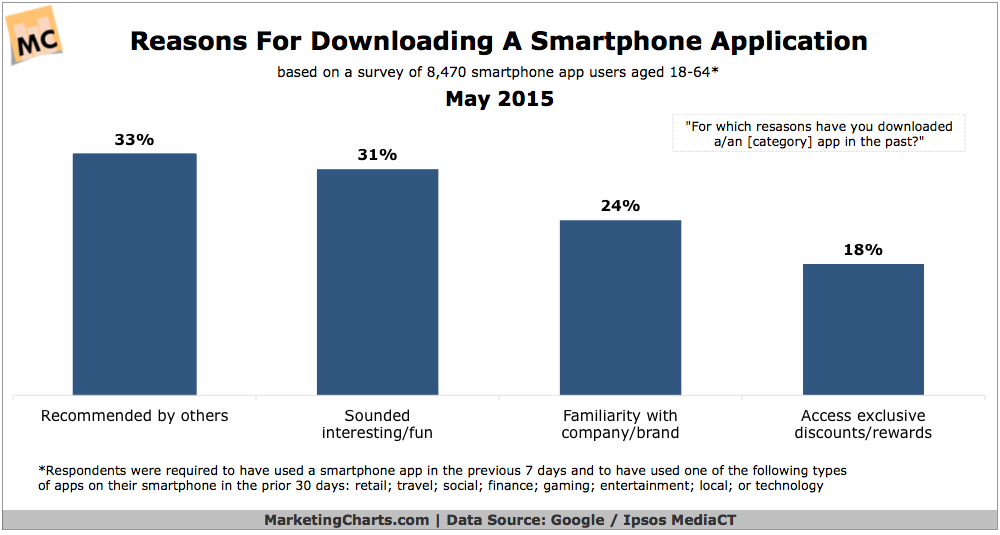
Word-of-mouth is a key driver of smartphone application discovery and a leading reason why users download apps.
Read MoreSocial TV Engagement Rates By Show Type, May 2015 [CHART]
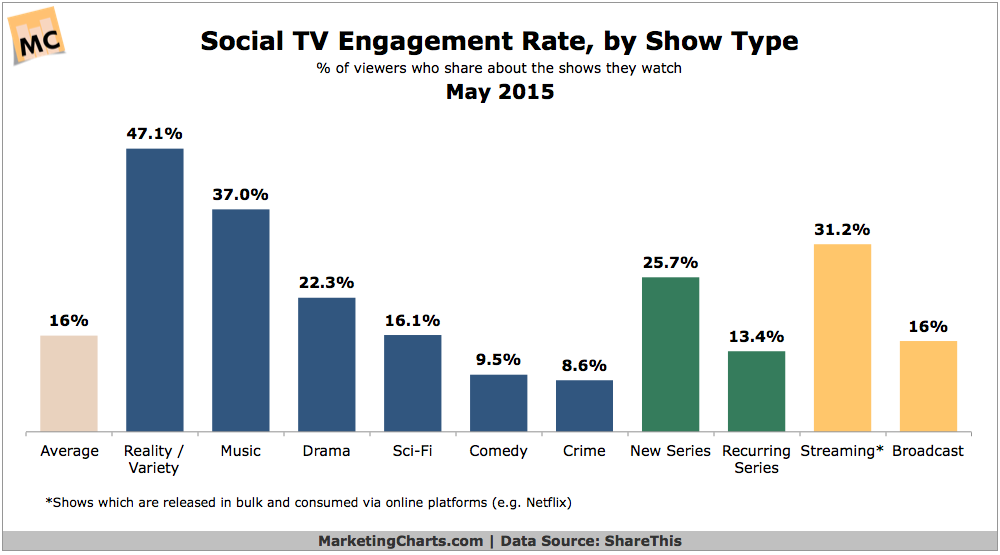
Some 16% of TV viewers on average share content about the shows they’re watching online, with these viewers driving an impressive 11% of all online sharing.
Read MoreAverage Email Read Rates By Subject Line Length, May 2015 [CHART]
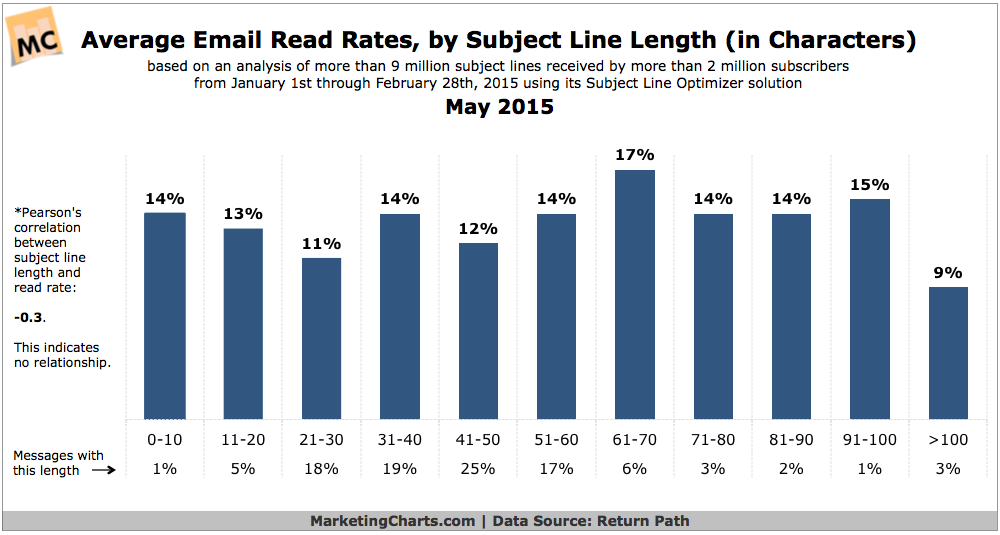
Email read rates: Consumers receiving a reported average of 416 commercial emails per month (and that was 2 years ago)…
Read MoreFacebook Exchange CTRs vs Facebook Custom Audiences CTRs, January-December 2014 [CHART]
In December 2014, the average CTR for US retargeted display ads run on WCA was 1.25%, vs. just 0.12% for FBX.
Read MoreMost-Used Travel Apps, February 2015 [CHART]
Map applications ranked as the No. 1 travel-related apps used by US smartphone owners when on trips, cited by 45%.
Read MoreMillennials' Top Shopping-Related Activities By Device [TABLE]
40% of Millennials said they use their smartphones to make an actual purchase vs. 65% doing so via computer.
Read MoreDaily Time Spent With Video By Device, 2011-2015 [CHART]
Adults in the US will spend an average of 5 hours, 31 minutes watching video each day this year.
Read More