Consumer Behavior
News Topics Consumed Via Twitter vs Facebook [CHART]
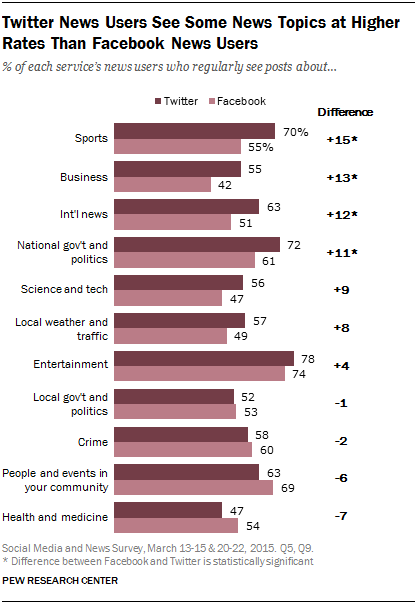
Roughly two-in-three Twitter news users (67%) report regularly seeing at least six of the 11 news topics asked about, compared with 57% of Facebook news users.
Read MoreTwitter Used For Breaking News [CHART]
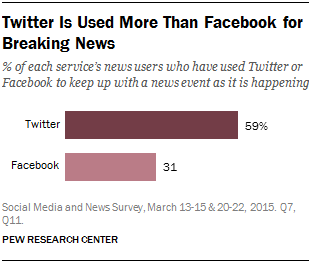
Nearly six-in-ten Twitter news users use the site to keep up with a news event as it is happening.
Read MoreTwitter vs. Facebook As A News Source [CHART]
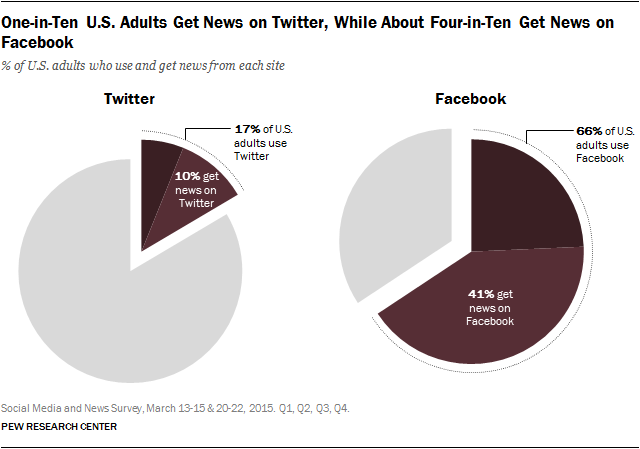
As of early 2015, 63% of Facebook and Twitter users get news on their respective sites.
Read MoreFacebook & Twitter As News Sources, 2113 & 2015 [CHART]
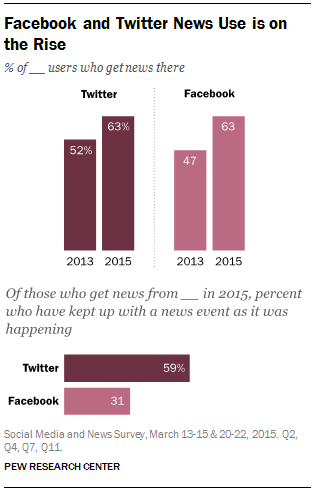
The share of Americans for whom Twitter and Facebook serve as a source of news is continuing to rise.
Read MoreThe History of Online Advertising [INFOGRAPHIC]
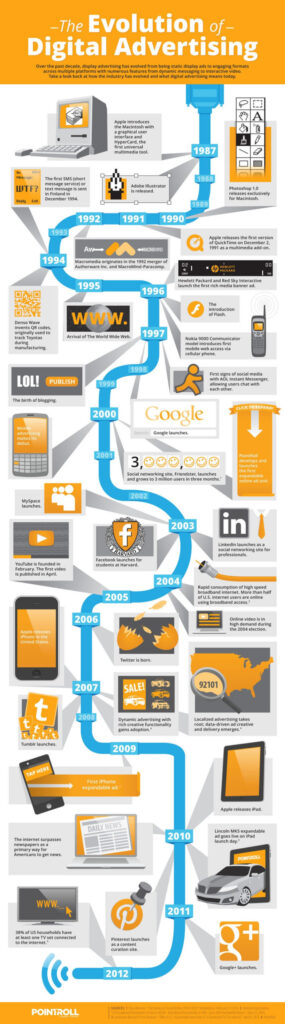
This infograph by PointRoll illustrates the history of online advertising.
Read MorePerceptions Of Color By Gender [INFOGRAPHIC]
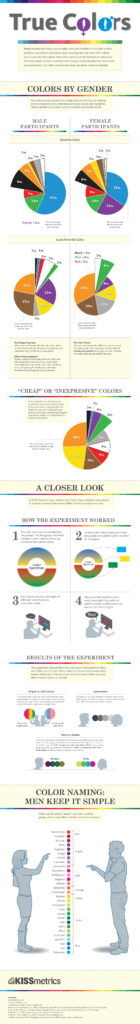
This infographic illustrates the different ways in which the genders perceive color.
Read MoreHow Frequently People Search For Local Businesses Via Mobile, 2013 & 2015 [CHART]
Local search has gone mobile, and recent research indicates that it’s critical for local businesses to have their mobile presence up to par.
Read MoreMost Popular Smart Watch Apps By Gender, October 2014 [TABLE]
Most Popular Smart Watch Apps By Gender: Women liked social networking apps the best while men liked sports and gaming apps best.
Read MoreThe Color Of Marketing [INFOGRAPHIC]
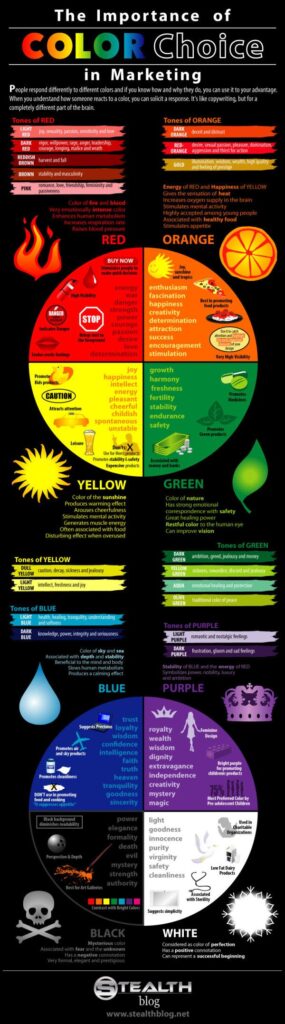
This infographic illustrates the psychological uses of color in marketing.
Read MorePsychology Of Social Commerce [INFOGRAPHIC]
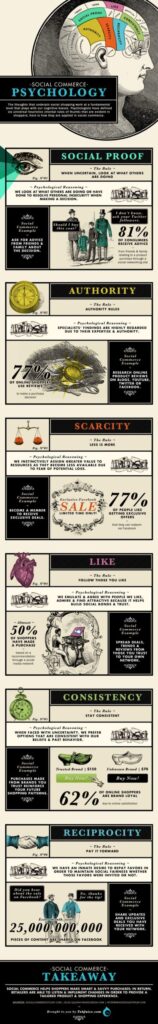
This infographic illustrates six dynamics of the psychology of social commerce.
Read More