Video Marketing
Social Media In 2013 [INFOGRAPHIC]
This infographic illustrates significant events in social media during 2013.
Read MoreA Year In Vines [PRESENTATION]
A retrospective of Vine’s first year.
Read MoreVideo Ad Metrics, October 2013 [CHART]
The three metrics most used among agency and brand professionals when buying digital video ads were impressions, clicks and completions.
Read MoreOverlap Between TV & Brand Tweeters, January 2014 [CHART]
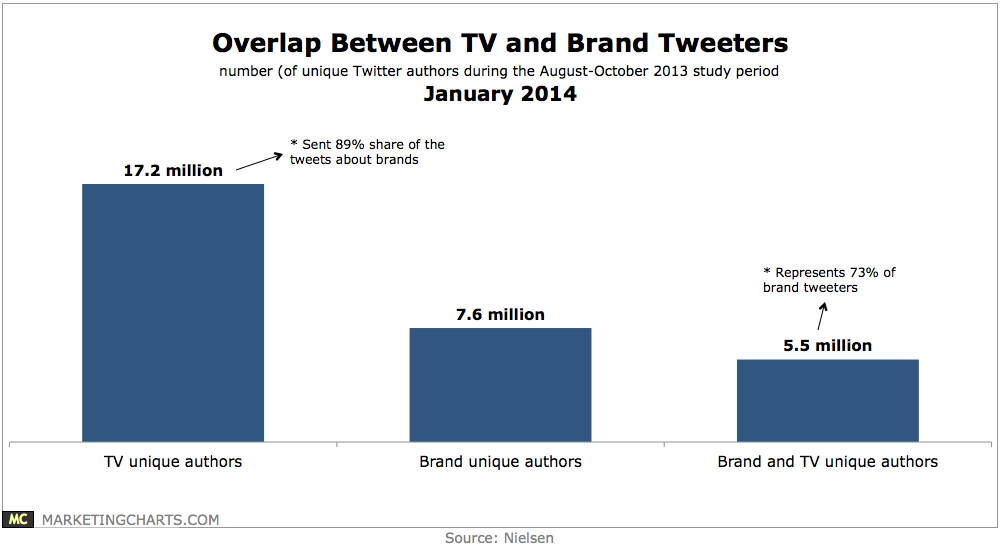
TV tweeters make up 73% of the number of people who tweeted about brands during the study period.
Read MorePay TV Subscription & Cord-Cutting, Q1 vs Q3 2013 [CHART]
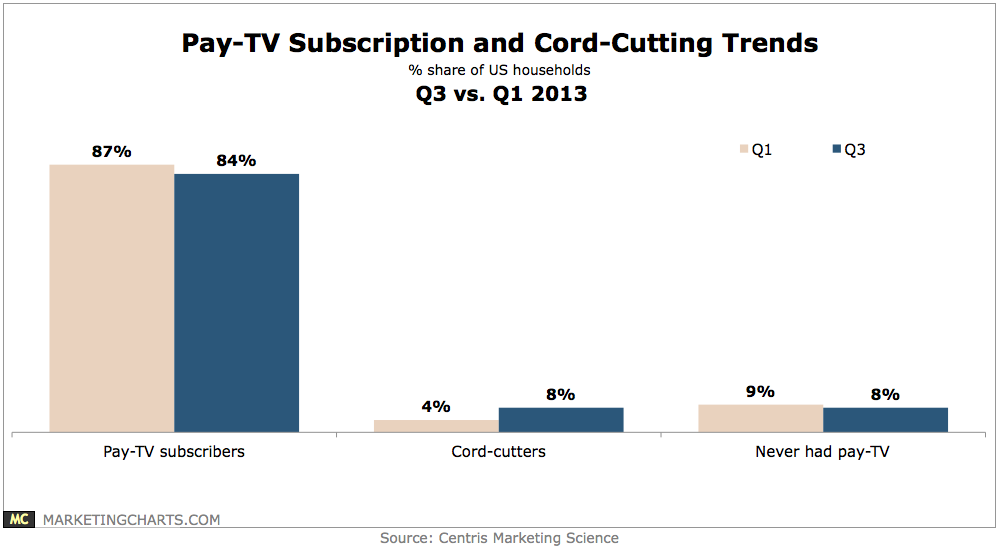
Centris indicates that 8% of US households reported having eliminated their pay-TV subscriptions in Q3 2013, double the percentage from the Q1 survey (4%).
Read MoreRetail Brand Social Adoption By Channel, January 2014 [CHART]
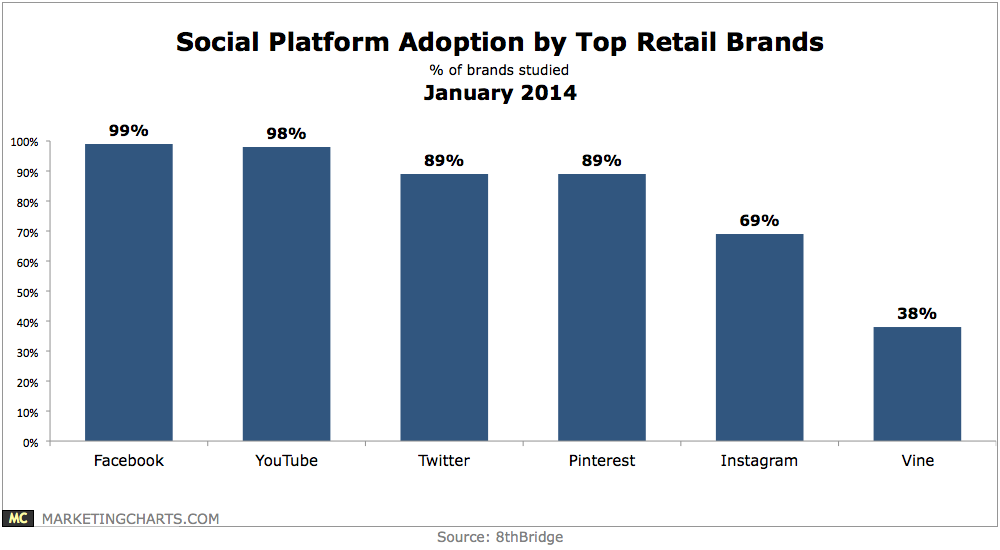
Some 38% of retail brands have already begun using Vine.
Read MoreWhere Home Improvers Get Inspiration, 2012 & 2013 [TABLE]
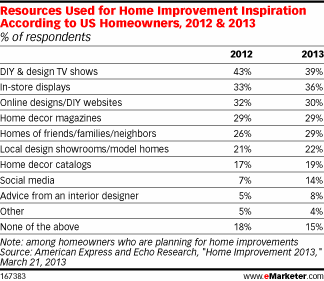
Data released in March 2013 by American Express and Echo Research revealed a large increase—albeit over a very small base—in homeowners who said social media provided inspiration for home improvement.
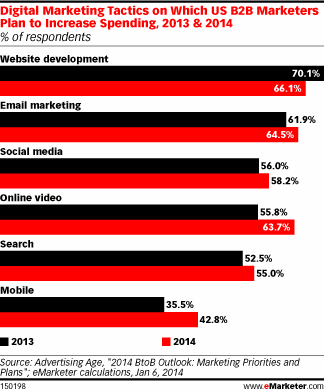
Read MoreOnline Marketing Tactics For Which B2B Marketers Plan To Increase Spending, 2013 & 2014 [VIDEO]
Three-quarters of business-to-business (B2B) marketers planned to up content spending in 2014, and just 1.3% said they would decrease their content budget.
Read MoreRichard Sherman Is Not A Thug…He's A Marketer
Was Richard Sherman’s rant against Michael Crabtree a result of heat of the moment passion or a deliberate attempt to provoke controversy for Beats by Dre?
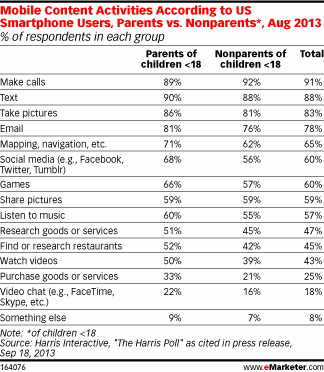
Read MoreMobile Content Activities Of American Parents, August 2013 [TABLE]
Parents of children under 18 were 5 percentage points more likely than nonparents to use email on their smart phone,
Read More
