Video Marketing
Global Programmatic Ad Pricing Trends, January 2013 vs January 2014 [CHART]
Social eCPM’s were 24% higher in January 2014 than they were a year earlier.
Read MoreTop 10 Online Video Properties, January 2014 [CHART]
The number of video views on Facebook more than tripled to 3.75 billion in December.
Read MoreSocial Media Millennials Prefer For Brand Communication, November 2013 [CHART]
YouTube overtook Facebook last year as the favorite website among US internet users ages 12 to 19.
Read MoreWebsites Millennials Use Frequently, November 2013 [TABLE]
Nearly three-quarters of 14- to 18-year-olds in the US said they used YouTube Frequently, compared with 60% who said the same for Facebook.
Read MoreBrands' Facebook & Instagram Integration, December 2013 [TABLE]
Nearly nine in 10 of the brands had both an Instagram and a Facebook account.
Read MoreMost Branded Video Ad Views By Top 5 Industries, Q4 2013 [CHART]
Videos focused around electronics products pulled in 365.0 million views.
Read MoreGlobal Branded Video Ad Views, Q4 2012-Q4 2013 [CHART]
Branded video ad views worldwide leapt more than 50% year over year in Q4 2013, from 1.78 billion to 2.71 billion.
Read MoreUS Online Ad Spending Growth By Format, 2012-2017 [TABLE]
Programmatic buying, native advertising and viewability all remain topical to digital display advertisers, particularly brands.
Read MoreMonthly Time Spent On Social Networks, July 2013 [TABLE]
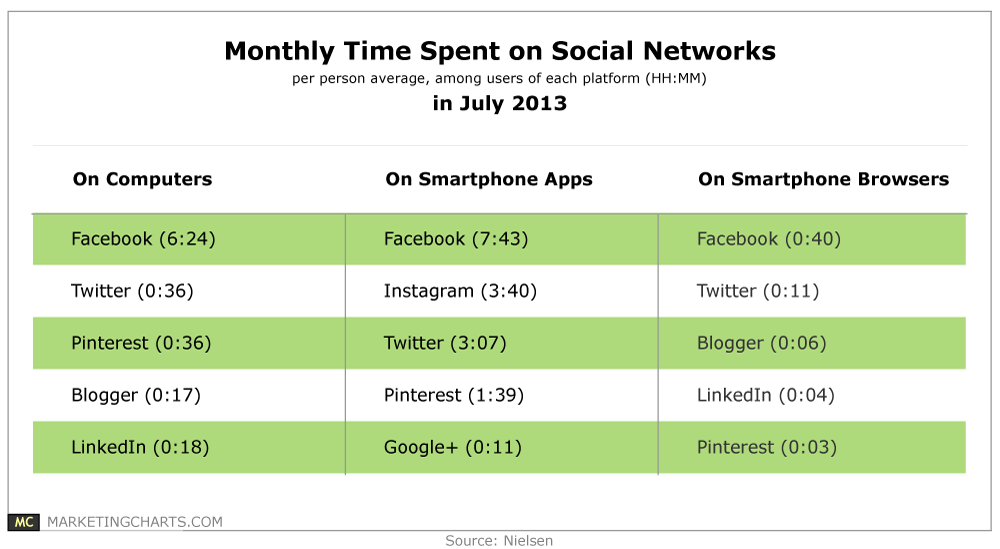
Among smartphone app users in July 2013, Instagram users were spending more time per person per month on the platform (3 hours and 40 minutes) than Twitter users (3 hours and 7 minutes).
Read MoreGlobal Traveler, 2014 [INFOGRAPHIC]
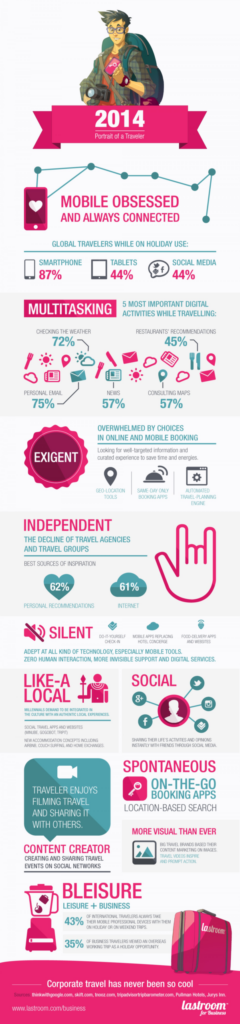
This infographic from LastRoom paints a picture of the behavior of the global traveler of 2014.
Read More