Video Marketing
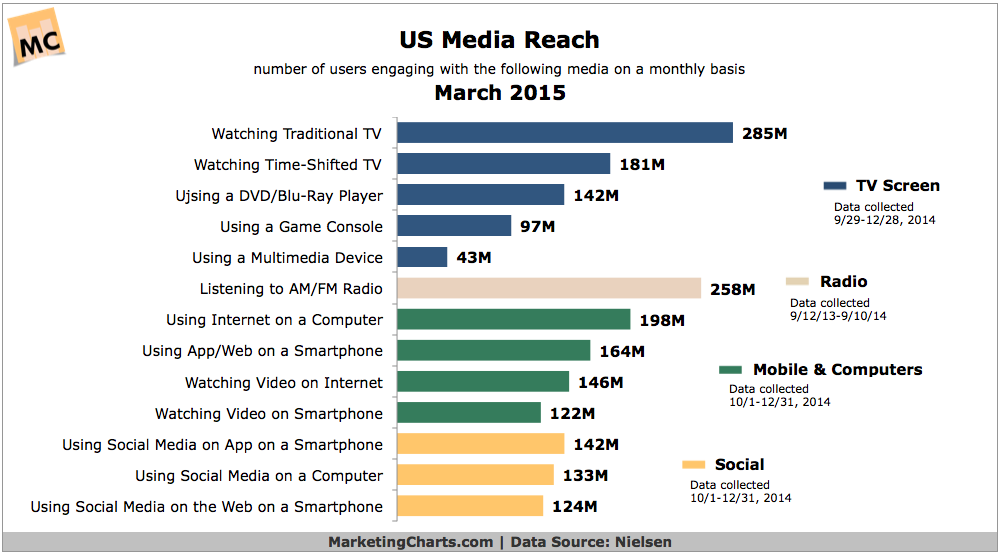
US Media Reach By Channel, March 2015 [CHART]
Some 142M Americans use social media applications on smartphones on a monthly basis, slightly higher than the number using social media on a computer 133 M.
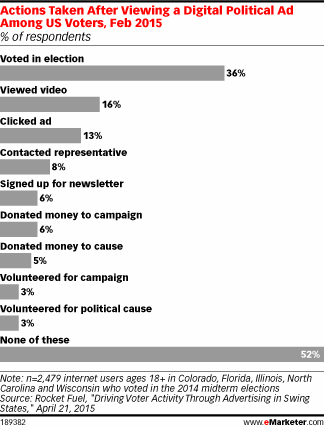
Read MoreWhat US Voters Do After Viewing An Online Political Ad, February 2015 [CHART]
Nearly half of US voters in the 2014 midterm elections from five swing states took some sort of action after viewing a online political ad.
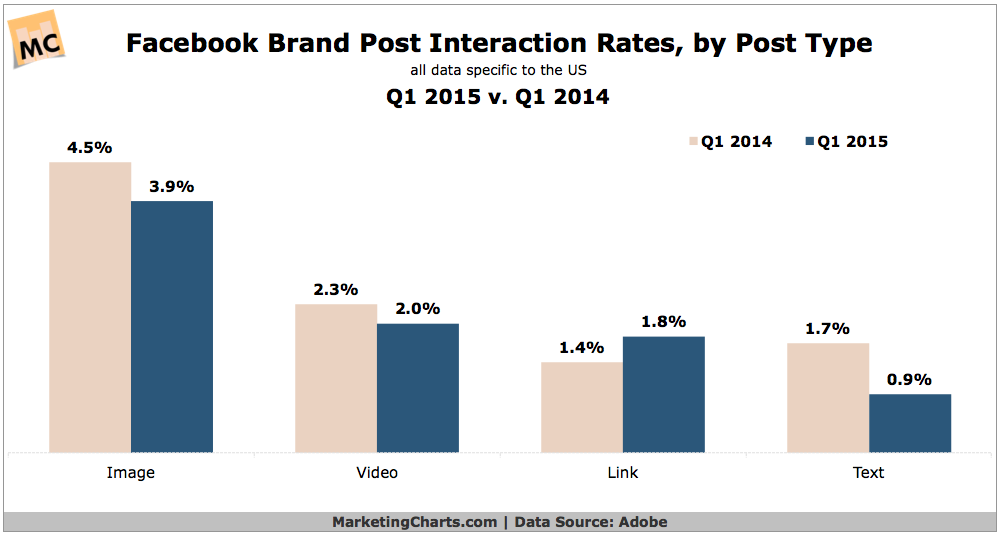
Read MoreFacebook Brand Post Interaction Rates, 2014 vs 2015 [CHART]
Algorithm changes enacted by Facebook in Q1 led to interaction rate declines across most post types.
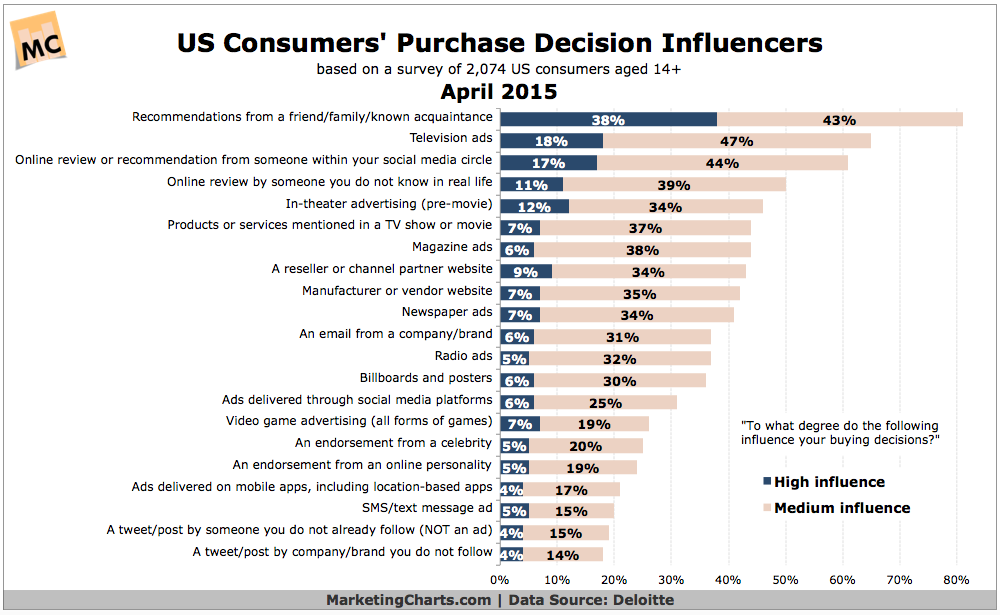
Read MoreTop Influences Over US Consumers' Purchase Decisions, April 2015 [CHART]
When it comes to influencing consumers’ purchases, word-of-mouth continues to outperform all paid media.
Read MoreEffective B2B Storytelling [INFOGRAPHIC]
This infographic via Entrepreneur illustrates with facts and stats some salient points about storytelling for B2B audiences.
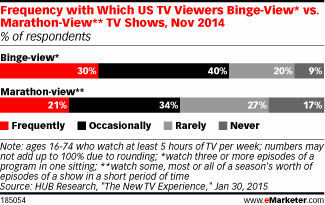
Read MoreTV Binge- vs Marathon-Viewing Frequency, November 2014 [CHART]
55% of US TV viewers marathon-viewed at least occasionally, with 21% doing so frequently.
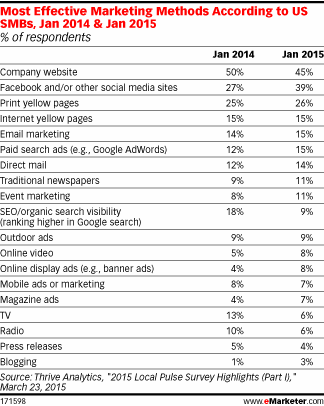
Read MoreSMBs' Most Effective Marketing Methods, 2014 vs 2015 [TABLE]
US small and medium-sized businesses were seeing more success with their website than any other channel.
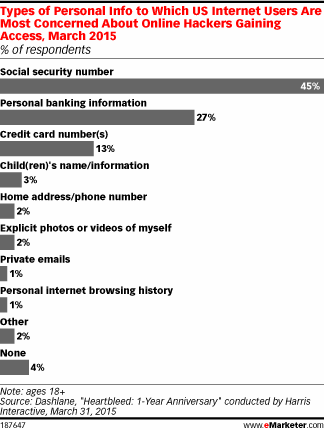
Read MoreTypes Of Information People Worry Hackers May Get, March 2015 [CHART]
People were most likely to worry about their social security numbers getting out.
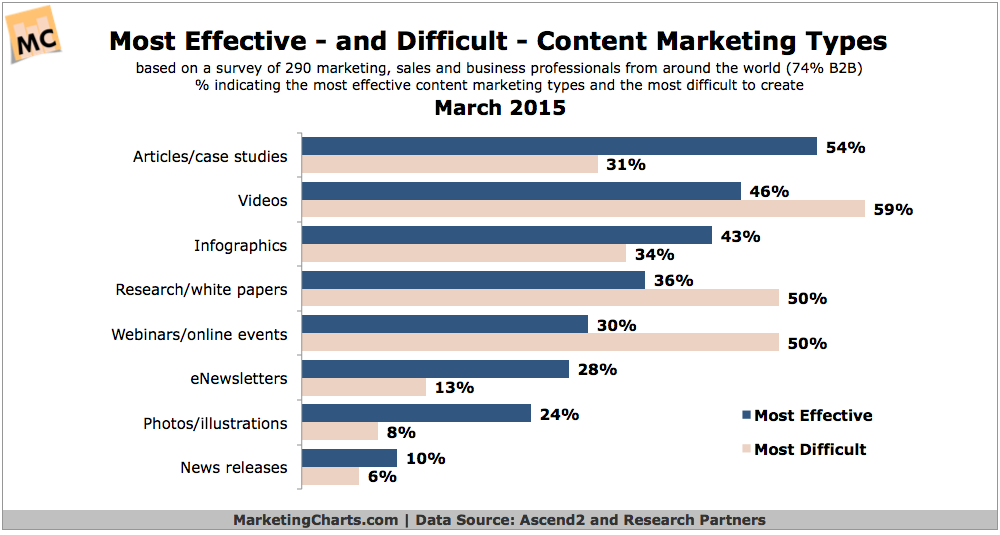
Read MoreMost Effective & Difficult Types Of Content Marketing, March 2015 [CHART]
Videos are a particularly challenging content type to create, although respondents also see value in them.
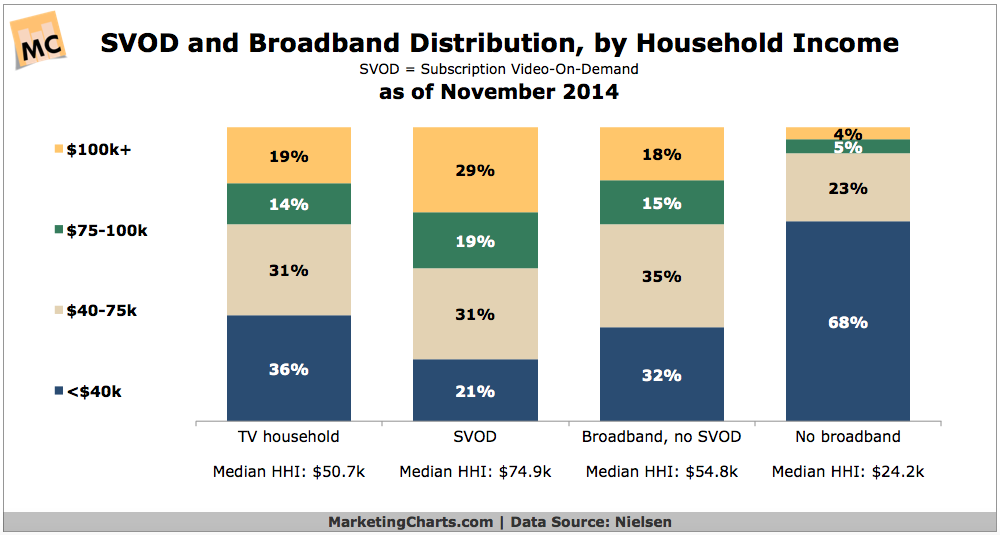
Read MoreStreaming Video On-Demand Penetration By Income, November 2014 [CHART]
4 in 10 US TV homes had access to at least one subscription video on demand service as of November 2014.
Read More